


Banking Analytics: Net Interest Margins Rise at U.S. Banks
Net interest margins (NIMs) at U.S. banks continued to increase in the first quarter of 2025 after rising steadily throughout 2024. NIMs measure the difference between the interest that a bank earns from investments, such as loans and investment securities, and the interest that it pays out on deposits and borrowings. The former is often referred to by the bank’s yield on assets held on balance sheet, while the latter describes the cost of funding for the bank.
Throughout 2024, banks benefited from increasing asset yields as interest rates on loans rose. This trend accelerated somewhat in the first quarter of 2025 as all sizes of banks saw decreasing funding costs, primarily through lowering interest rates paid to depositors.The Federal Reserve defines community banks as banking organizations with less than $10 billion in total assets and regional banks as banking organizations with total assets between $10 billion and $100 billion. Large banks are defined as banking organizations with total assets of more than $100 billion. (See figure below.)
Net Interest Margin (Asset-Weighted Average)
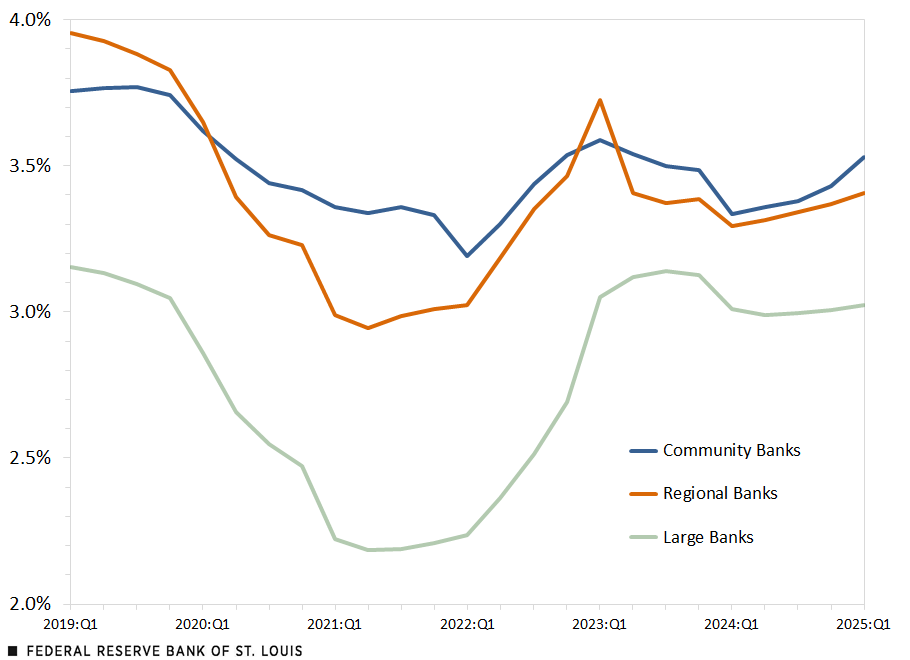
SOURCES: Consolidated Reports of Condition and Income (Call Report) and authors’ calculations.
NOTES: Community banks have less than $10 billion in total assets; regional banks have between $10 billion and $100 billion in total assets; and large banks have more than $100 billion in total assets.
The NIM is a measure of profitability in banking. A higher NIM indicates that a bank is earning sufficiently more on its assets than it is paying on its liabilities, which boosts overall profits. A lower NIM indicates the opposite: The bank is not making as much on the spread between asset yields and funding costs.
Large banks often tolerate lower NIMs, as they earn revenue generated from sources other than interest on loans, such as wealth management services and investment banking activities. Conversely, community and regional banks depend more on traditional core banking operations: collecting deposits and making loans. For them, a healthy NIM is vital to support overall profitability.
Note
- The Federal Reserve defines community banks as banking organizations with less than $10 billion in total assets and regional banks as banking organizations with total assets between $10 billion and $100 billion. Large banks are defined as banking organizations with total assets of more than $100 billion.


Citation
Suzanne Jenkins and Richard Zott, ldquoBanking Analytics: Net Interest Margins Rise at U.S. Banks,rdquo St. Louis Fed On the Economy, June 10, 2025.
This blog offers commentary, analysis and data from our economists and experts. Views expressed are not necessarily those of the St. Louis Fed or Federal Reserve System.
Email Us
All other blog-related questions