


The Sluggish Renaissance of U.S. Manufacturing
Geopolitical tensions have spurred a revival of U.S. manufacturing, an argument in favor of reshoring manufacturing jobs. At the end of 2024, about 12.6 million people were employed in the manufacturing sector. This represents about 9.3% of total private sector employment. While manufacturing was once a leading source of jobs, employment in the sector has declined over the past decades as the economy has shifted toward service industries. It averaged 33.7% of employment in 1960 and 19.4% in 1990. Although not enough to reverse this downward trend, the number of manufacturing employees has been slowly recovering over the past decade (barring the COVID-19 pandemic dip), fluctuating at above 12 million people.
In this blog post, we examine the recent evolution of manufacturing employment and its relationship with the number of manufacturing establishments.
The Slow Recovery of Manufacturing
We use data from the U.S. Bureau of Labor Statistics’ Quarterly Census of Employment and Wages (QCEW). The QCEW data cover more than 95% of U.S. employment and allow us to look at employment and establishments by industry and geography at a quarterly frequency from 1990 to 2024.An establishment is a fixed physical location where economic activity occurs. A firm may have one establishment (a single-unit establishment) or many establishments (a multi-unit firm).
The figure below shows the number of manufacturing employees, number of manufacturing establishments, and the counterfactual number of manufacturing employees if the number of establishments had stayed at first quarter 2014 levels from then onward. An increase in the number of manufacturing establishments from 336,000 at the start of 2014 to 401,000 in the fourth quarter of 2024 helps explain why jobs in this sector did not fall over the past decade. If the number of establishments had stayed at its 2014 level, the U.S. economy would have had 2 million fewer jobs in manufacturing at the end of 2024.
Employment and Establishments in the Manufacturing Sector
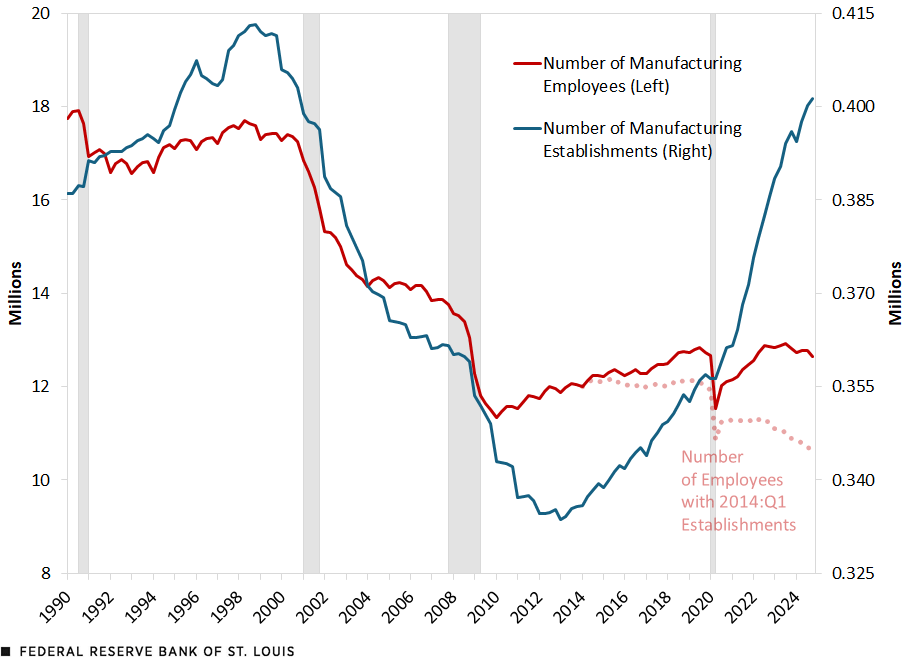
SOURCES: Bureau of Labor Statistics and authors’ calculations.
NOTES: Excludes government employees and establishments. The counterfactual number of employees in manufacturing (light pink, left axis) is computed as the product of the number of manufacturing establishments in the first quarter of 2014 and the realized average number of employees per manufacturing establishment in a quarter. Shaded areas indicate recessions measured on a quarterly basis.
The number of establishments is informative about the evolution of employment in the sector because manufacturing establishments require more workers to operate than other industries. Although the average number of employees per manufacturing establishment has been falling steadily over the past decades as the adoption of automation has become more prevalent, a manufacturing establishment still employed an average of 32 workers in 2024. That is considerably higher than for other industries. For instance, an establishment in the retail industry employed an average of 15 workers in 2024, while an establishment in the real estate and rental and leasing industry employed fewer than five.
A few subindustries drove the bulk of manufacturing’s sluggish recovery over the past decade. The figure below shows the contribution of each subindustry to the overall increase in manufacturing employment and number of establishments from 2014 to 2024. Food manufacturing, beverage and tobacco product manufacturing, chemical manufacturing, and transportation equipment manufacturing contributed the most to the sector’s revival during this period. For instance, the food manufacturing industry drove 19% of the increase in the number of manufacturing establishments and 49% of the rise in manufacturing employment over the past decade.
Contribution to 2014-24 Growth in Manufacturing Employment and Establishments by Subindustries
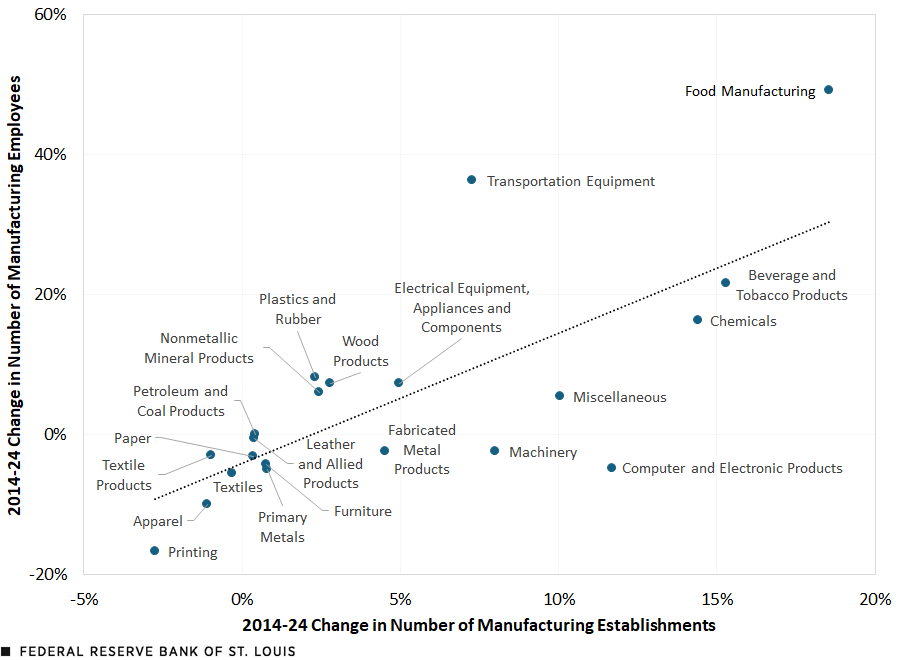
SOURCES: Bureau of Labor Statistics and authors’ calculations.
NOTES: Excludes government employees and establishments. Each point in the plot represents a manufacturing subindustry corresponding to NAICS codes at the three-digit level. A subindustry’s contribution to the change in the number of employees and the number of establishments in manufacturing takes into account its shares.
Where Is the Recovery of Manufacturing Unfolding?
U.S. states differ significantly in terms of the size of their manufacturing sectors; larger states tend to have more people employed in manufacturing and more establishments. The map below shows the geographical distribution of states’ shares of U.S. manufacturing employment in 2014. The states with the largest shares of manufacturing workers were California, Texas, Ohio, Illinois, Michigan and Pennsylvania. For instance, California employed 10.4% of all manufacturing workers in the U.S., while Texas had 7.3% of manufacturing workers.
States’ Shares of U.S. Manufacturing Employment in 2014

SOURCES: Bureau of Labor Statistics and authors’ calculations.
NOTES: Excludes government employees and establishments. The number for each state represents its share of total U.S. manufacturing employment in 2014.
Which states have played the largest role in manufacturing’s recent recovery? The figure below shows the contribution of each state to the overall increase in manufacturing employment and number of establishments from 2014 to 2024. Florida, Texas and Georgia drove most of the revival in U.S. manufacturing, with Florida contributing 17% to the rise in manufacturing employment and 13% to the rise in manufacturing establishments over the past decade.
Contribution to 2014-24 Growth in Manufacturing Employment and Establishments by State
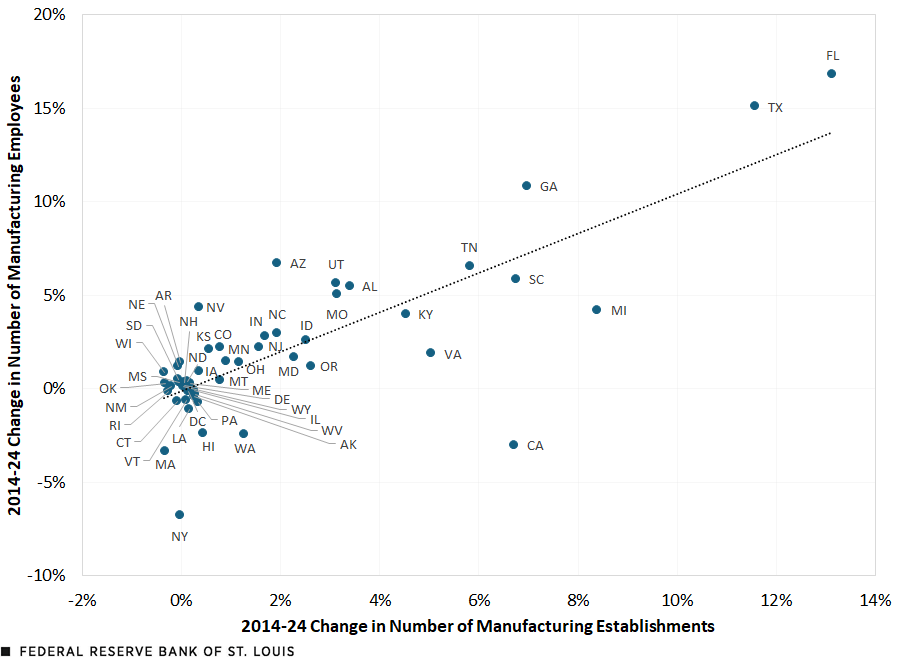
SOURCES: Bureau of Labor Statistics and authors’ calculations.
NOTES: Excludes government employees and establishments. A state’s contribution to the change in the number of employees and the number of establishments in manufacturing takes into account its shares.
Takeaways
The U.S. manufacturing sector has declined for most of the past 60 years as the economy has shifted toward service industries. Starting in 2014, manufacturing employment has been slowly recovering, pushed by an upswing in the number of manufacturing establishments. Over the past decade, manufacturing employment and establishments grew 5% and 19%, respectively, to 12.6 million people and to 401,000 establishments. If the number of establishments had stayed at its 2014 level, the U.S. economy would have had an estimated 2 million fewer manufacturing jobs.
About half of the sector’s increase in employment over the past 10 years was driven by the food manufacturing subindustry. That subindustry also contributed the most to the increase in manufacturing establishments during this period. In terms of geography, Florida and Texas were the engines of the revival, jointly explaining 32% of the increase in manufacturing employment and 25% of the rise in manufacturing establishments.
Note
- An establishment is a fixed physical location where economic activity occurs. A firm may have one establishment (a single-unit establishment) or many establishments (a multi-unit firm).


Citation
Ricardo Marto and Hoang Le, ldquoThe Sluggish Renaissance of U.S. Manufacturing,rdquo St. Louis Fed On the Economy, Aug. 12, 2025.
This blog offers commentary, analysis and data from our economists and experts. Views expressed are not necessarily those of the St. Louis Fed or Federal Reserve System.
Email Us
All other blog-related questions