


How Changes in Trade Partners Have Affected U.S. Import Prices
Over the past two decades, U.S. firms have restructured their global supply chains, shifting from traditional trading partners like Canada, Japan and the European Union (EU) to lower-cost suppliers such as China and other emerging economies. This transformation accelerated during the 2000s but began to reverse in recent years, as firms diversify away from China amid a broader process of economic decoupling.
These dynamics are evident in the data: China’s share of U.S. imports rose sharply in the early 2000s and remained elevated through the mid-2010s before beginning to decline around 2017, as the first figure below shows.
China’s Share of U.S. Imports Declined after 2016 Peak
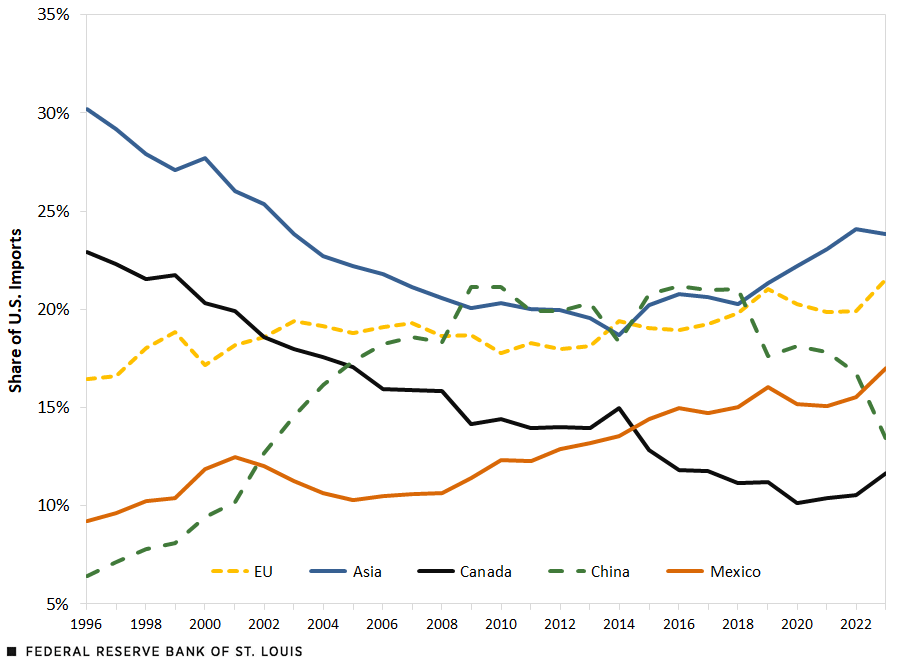
SOURCES: U.N. Comtrade, Bureau of Labor Statistics and authors’ calculations.
During the early 2000s to mid-2010s, U.S. import prices rose more slowly than domestic price indexes such as the consumer price index (CPI) and the producer price index (PPI), as the figure below shows.We use an import price index that we computed from Comtrade data. We found that this index features dynamics very similar to those of the import price index from the U.S. Bureau of Labor Statistics. See the cited source in Endnote 2 for more information on our methodology. These trends suggest that the increased reliance on low-cost suppliers—particularly China—may have helped restrain the growth of U.S. import prices, an effect that may have started reversing.
Domestic Prices Have Outpaced Import Prices
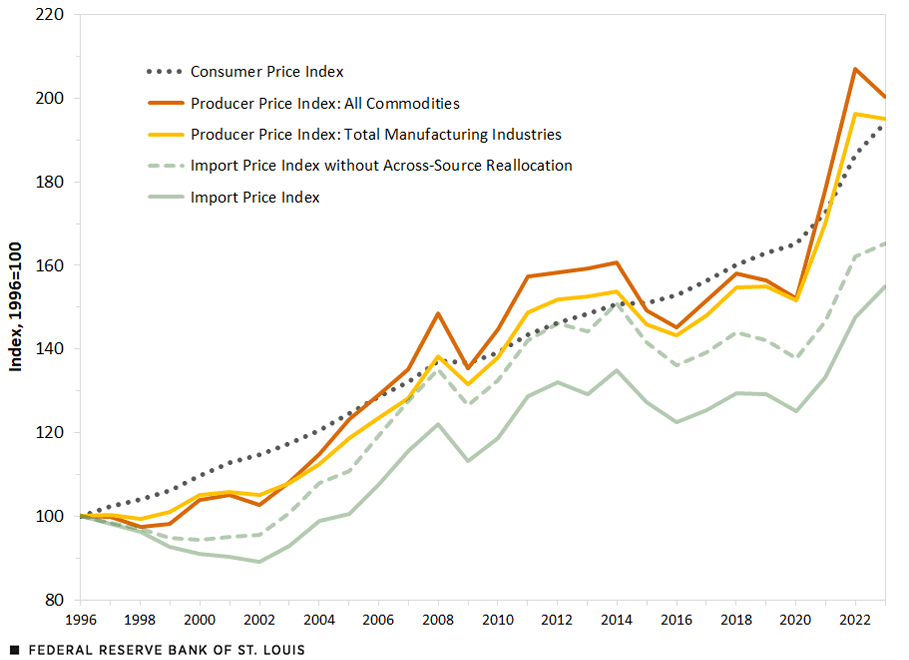
SOURCES: U.N. Comtrade, Bureau of Labor Statistics and authors’ calculations.
NOTE: Across-source reallocation is the price effect from shifting the import source to another country.
In this blog post, we examine how these shifts in the composition of U.S. import suppliers have affected import prices. Our analysis builds on a companion working paper,Dawn Chinagorom-Abiakalam and Fernando Leibovici, “Import Source Reallocation and Aggregate Price Dynamics in the United States,” Federal Reserve Bank of St. Louis Working Paper 2025-018A, August 2025. where we present the methodology and results in greater detail.
Cross-Country Differences in Import Prices
To study the effect of changes in import sourcing patterns on import prices, we begin by documenting how import prices vary across countries. We use annual trade data from the U.N. Comtrade database, which reports the value and quantity of U.S. imports by product and source country. We compute unit values, defined as import value divided by quantity, as a proxy for prices. While unit values can reflect differences in product quality, they provide a useful basis for comparing pricing patterns across countries and products.To reduce the influence of outliers, we restricted the sample to countries accounting for the top 95% of import value within each HS product. We dropped observations with missing quantities, inconsistent units or extreme values—defined as unit values or changes falling outside the 2.5th to 97.5th percentile of the full distribution.
In 2023, China was the lowest-cost supplier for more than 15% of the products the U.S. imported. The next figures illustrate two dimensions of this pattern: the first figure shows the share of products for which each country was the lowest-cost supplier, while the second figure compares average price levels across countries relative to Canada.
China Was the Lowest-Cost Source for more than 15% of U.S. Import Products in 2023
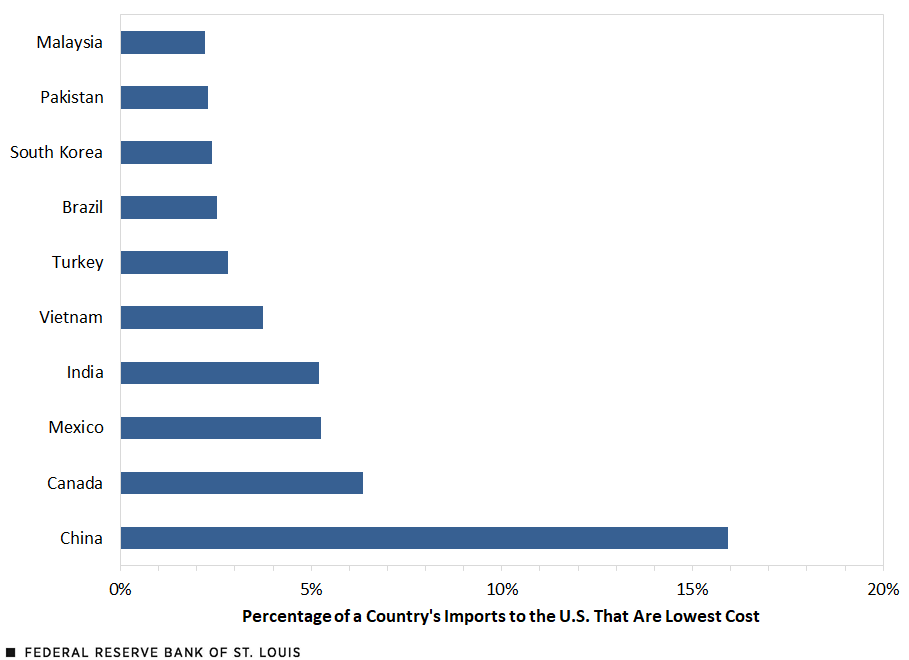
SOURCES: U.N. Comtrade and authors’ calculations.
NOTES: Unit values, defined as import value divided by quantity, are used as a proxy for prices. The sample of countries compared includes those accounting for the top 95% of import value within each Harmonized System product.
The figure below controls for product-fixed effects at the six-digit Harmonized System (HS) level, ensuring that price differences reflect variation for the same products. The HS is a standardized system for classifying imported and exported products. Countries like China and Vietnam consistently supplied goods at lower unit values, indicating that sourcing composition may play a meaningful role in shaping overall price levels.
Countries Like China and Vietnam Consistently Supplied Lower-Priced Goods
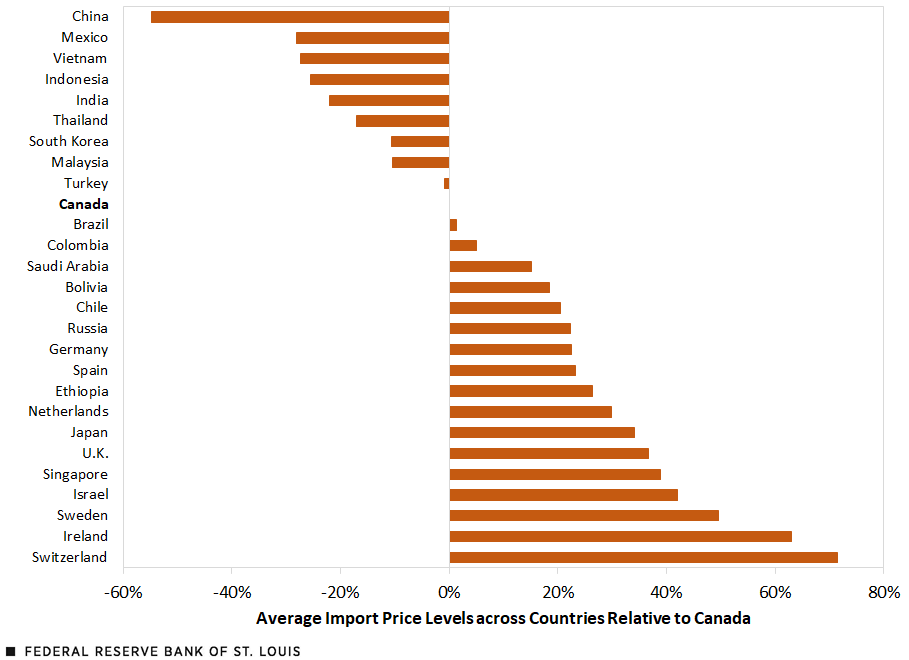
SOURCES: U.N. Comtrade and authors’ calculations.
NOTES: Unit values, defined as import value divided by quantity, are used as a proxy for prices. Figure data are controlled for product fixed effects at the six-digit level of the HS classification. The sample of countries compared includes those accounting for the top 95% of import value within each HS product.
Price dynamics also differ across trading partners. As shown in the next figure, import prices from Mexico, Canada and the EU have increased substantially and fluctuated over time, while prices from China have remained relatively stable. This stability suggests that sourcing from China helped dampen U.S. import price growth—particularly during periods when other source-country prices rose more sharply.
U.S. Import Price Indexes by Source Country
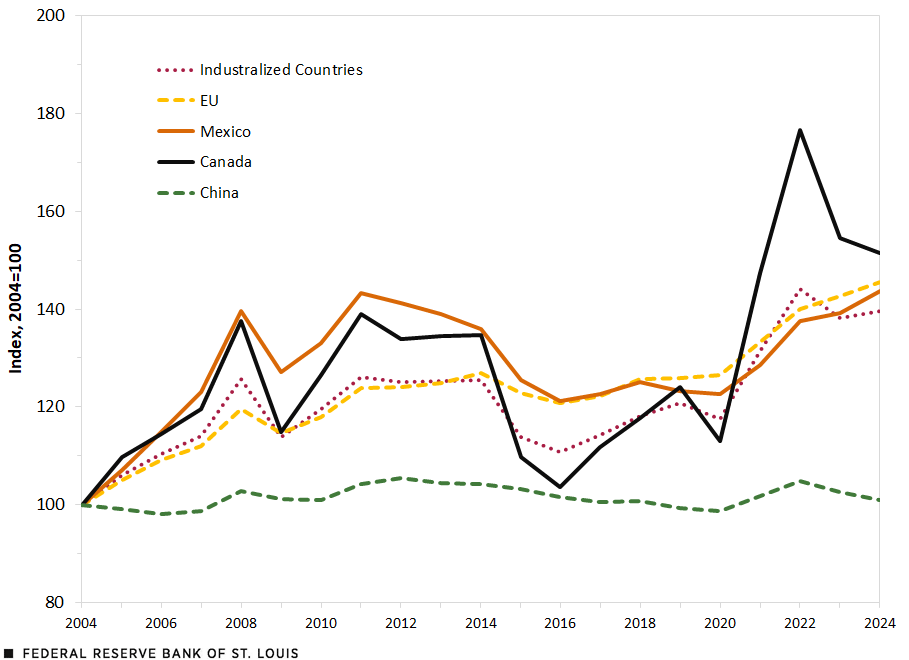
SOURCES: U.N. Comtrade data and authors’ calculations.
Changes in Import Sourcing and the Dynamics of Import Prices
We next decomposed changes in the overall U.S. import price index into two components, following the methodology described in the companion working paper:
- Within-source price changes: Changes in the prices paid for each country-product pair; for example, the price effect caused by declining prices of Chinese-made machinery imports
- Sourcing reallocation effects: Changes in prices due to shifts in sourcing shares across countries for the same product; for example, the price effect caused by importing machinery from China instead of from Germany
The next figure shows that most of the cumulative increase in U.S. import prices since 1996 was driven by within-country price increases (dashed blue line). However, sourcing reallocation (dashed red line) exerted significant downward pressure in the 2000s, reducing overall import prices by as much as 10 percentage points. This effect has since diminished—and turned positive—as sourcing moved away from China.
Decomposition of Import Price Changes
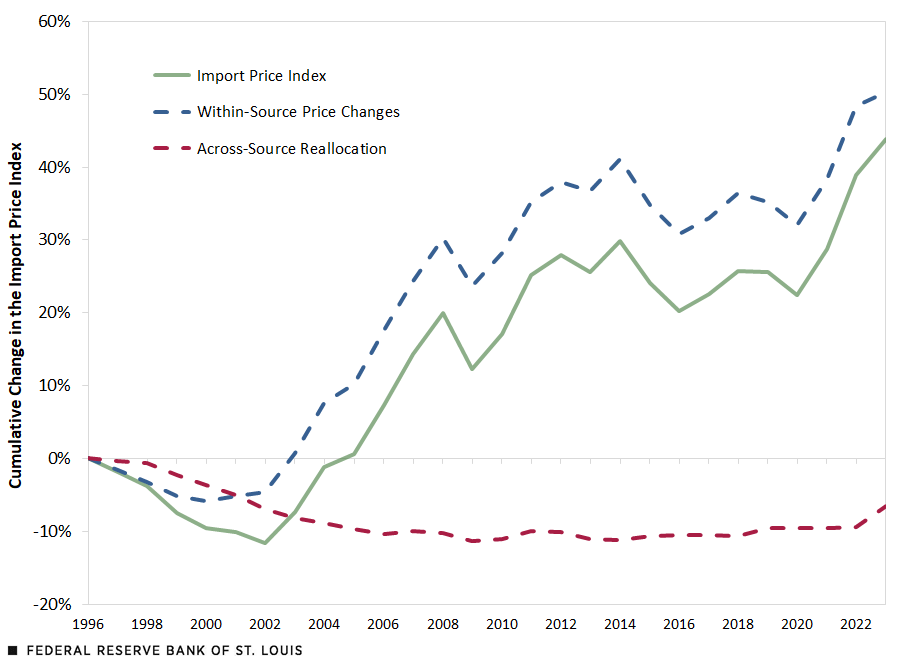
SOURCE: Chinagorom-Abiakalam and Leibovici (2025).
This pattern suggests that changes in sourcing composition initially helped curb import price growth but then started contributing to price increases as firms reduce reliance on lower-cost suppliers. Indeed, the second figure in this blog post shows that in the absence of sourcing reallocation, the path of U.S. import prices would have more closely tracked domestic price indexes such as the CPI and PPI, highlighting the significant role that supplier shifts have played in shaping aggregate price dynamics.
To better understand the sourcing reallocation effect, we broke it down by region. The next figure shows that China was the primary driver of the reallocation effect through 2017, significantly lowering U.S. import prices during that period. Since 2018, however, this effect reversed, with sourcing away from China putting upward pressure on import prices. In contrast, reallocation effects from other regions, such as North America and the EU, remained relatively flat.
These results reinforce the importance of tracking not only price changes within countries but also shifts in the composition of U.S. import suppliers over time.
Reallocating Sourcing to China Put the Biggest Downward Pressure on U.S. Import Prices
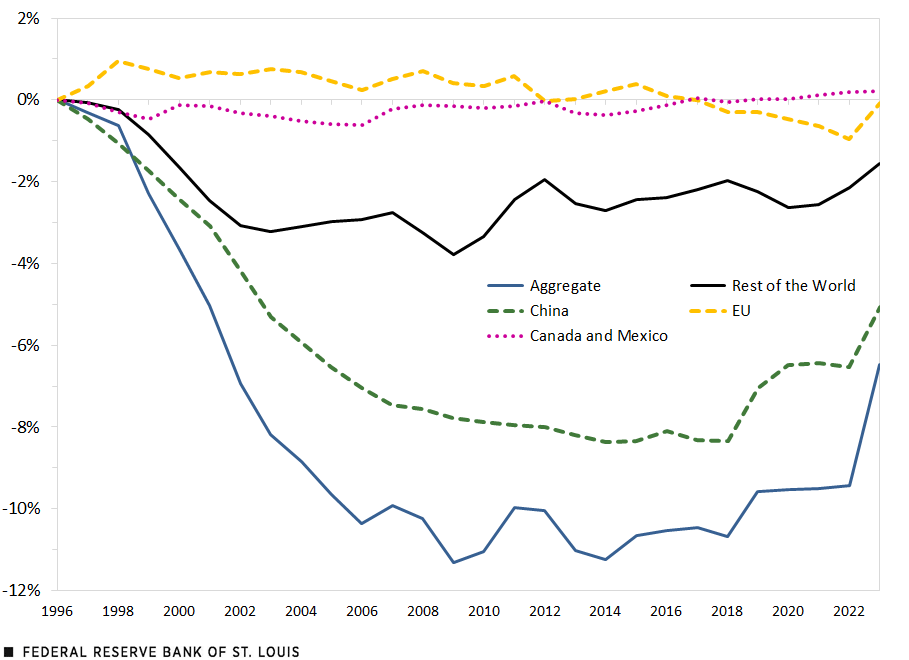
SOURCE: Chinagorom-Abiakalam and Leibovici (2025).
Conclusion
Our analysis shows that changes in the composition of U.S. import suppliers play an important role in shaping overall import price dynamics. In particular, the expansion of sourcing from China in the 2000s helped contain import price growth, while more recent shifts away from China started reversing that effect.
Understanding these sourcing effects is critical for assessing U.S. price trends. As global supply chains continue to evolve, it will be important to monitor not only price changes within countries, but also the shifting composition of the source of these imports.
Notes
- We use an import price index that we computed from Comtrade data. We found that this index features dynamics very similar to those of the import price index from the U.S. Bureau of Labor Statistics. See the cited source in Endnote 2 for more information on our methodology.
- Dawn Chinagorom-Abiakalam and Fernando Leibovici, “Import Source Reallocation and Aggregate Price Dynamics in the United States,” Federal Reserve Bank of St. Louis Working Paper 2025-018A, August 2025.
- To reduce the influence of outliers, we restricted the sample to countries accounting for the top 95% of import value within each HS product. We dropped observations with missing quantities, inconsistent units or extreme values—defined as unit values or changes falling outside the 2.5th to 97.5th percentile of the full distribution.


Citation
Fernando Leibovici and Dawn Chinagorom-Abiakalam, ldquoHow Changes in Trade Partners Have Affected U.S. Import Prices,rdquo St. Louis Fed On the Economy, Aug. 21, 2025.
This blog offers commentary, analysis and data from our economists and experts. Views expressed are not necessarily those of the St. Louis Fed or Federal Reserve System.
Email Us
All other blog-related questions