


Profit Shifting in the 21st Century: Multinationals’ Use of Intrafirm Patent Transfers
In the modern globalized economy, multinational companies (MNCs) can conduct business in markets across the world quickly and efficiently. However, one byproduct of a globalized economy is that multinationals are often able to shift their profits to subsidiaries across jurisdictions in order to minimize their overall tax burden. A common mechanism for profit shifting, and the focus of this blog post, is transferring the ownership of intellectual property (IP). Transferring patents, trademarks and copyrights across a corporate ownership tree allows MNCs to book profits in the jurisdictions with the lowest applicable taxes.
How Patent Transfers Can Shift Profits
The specific mechanism on which we focus in this article is MNCs’ shifting patent ownership to affiliated companies, i.e., subsidiaries. This method is popular because intangibles, such as those mentioned above, are not physical objects and thus incur little to no trade costs when they are instantly moved across the globe. Patents give the owners of IP exclusive rights over the sale and licensing of that IP in the jurisdiction in which the patent has been granted. By moving the ownership of the IP to lower-tax regions, MNCs can license the technology from these low-tax jurisdictions to their affiliated companies in higher-tax jurisdictions.
Through this shifting mechanism, MNCs move global profits out of high-tax jurisdictions via intrafirm royalty payments. This practice has become especially prevalent since the turn of this century. In this blog post, we follow trends in global patent transactions using a data set of global IP transactions available through IP data provider ktMINE.
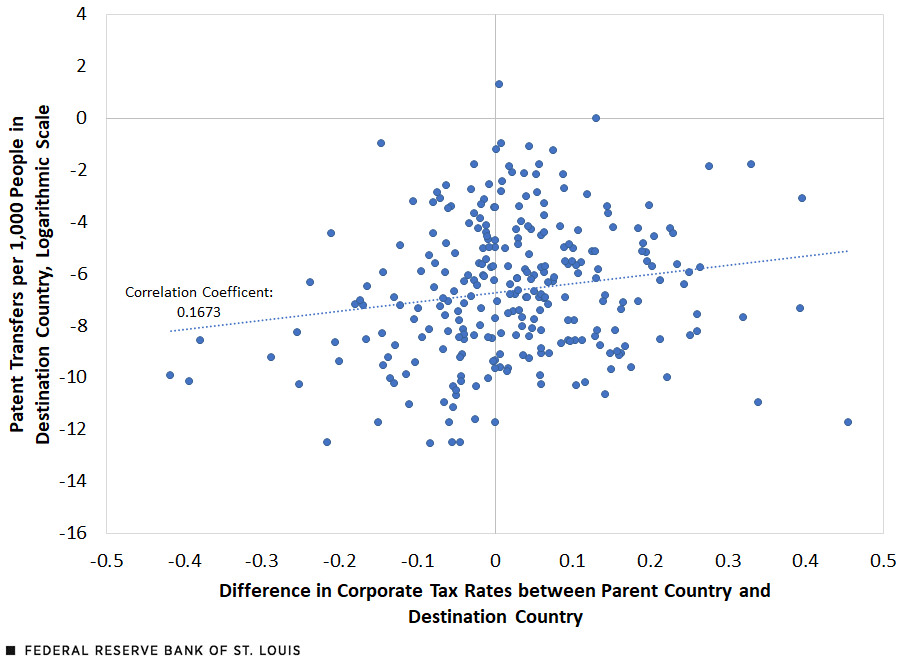
The scatterplots below showcase the relationship between patent transfers and the difference in corporate tax rates between countries, using tax data from the Tax Foundation. To avoid transfers occurring between countries that are tax havens, we focus on patent transfers that originate in non-tax haven countries. This has already been documented by Jesse LaBelle and Ana Maria Santacreu in a 2022 Economic Synopses essay.
To highlight the differing trend after the turn of this century, we split the sample into two periods: patent transfers occurring from 1980 to 2000 and patent transfers from 2001 to 2015. We measured the natural logarithm of patent transfers per 1,000 people to account for the fact that larger countries may naturally attract more patent transfers.
Patent Transfers: 1980-2000
Patent Transfers: 2001-15

SOURCES FOR BOTH FIGURES: ktMINE, Tax Foundation and authors’ calculations.
NOTES FOR BOTH FIGURES: The dotted line is a regression line. The x-axis represents the difference in the tax rates expressed in decimals; for example, the difference between a 40% tax rate in the origin country and a 30% rate in the destination country is 0.1. Transfers are summed across the entire time period. Average population of the destination country is used to calculate transfers per capita. The following destination countries are excluded because of missing corporate tax rates or property rights for all years: American Samoa, Anguilla, Antigua and Barbuda, Bermuda, British Virgin Islands, Cayman Islands, Cook Islands, Cuba, Curaçao, Gibraltar, Guam, Marshall Islands, North Korea, St. Kitts and Nevis, Turks and Caicos Islands, and Vanuatu. The following origin countries are excluded because of missing corporate tax rates for all years: Albania, Algeria, British Indian Ocean Territory, Comoros, Czechoslovakia, Djibouti, East Germany, Guam, Marshall Islands, Myanmar, New Caledonia, North Korea, São Tomé and Príncipe, Somalia and Soviet Union. The British Virgin Islands are also excluded both from destination and from origin countries. Data include only transfers that originate from non-tax havens.
As shown in the figures above, the correlation between patent transfers and corporate tax difference is positive (a greater tax difference between an origin and a destination is associated with a greater number of patents transferred between the two), and the correlation becomes even stronger after 2000, increasing from about 17% to 41%. This suggests an increase in the importance of tax differences when transferring patents in the period since 2000. Moreover, there are many more patent transactions in the period 2001-15, reflecting an overall increase in patent transactions.
It is important to note that not all patent transfers are necessarily examples of profit shifting. Patent transfers can occur for other reasons as well. For example, it is possible a company will simply purchase patents from another company located in a different jurisdiction. However, this is less likely to be the explanation for transfers that occur within the same corporate structure, especially those to tax havens with little to no production infrastructure, such as Caribbean tax havens. Governments should be mindful of the practice of intrafirm transferring because it can result in large tax revenue losses in countries where the IP is produced or used. This begs the question: Which countries are losing the most patents transferred to other regions?
Where Are Patents Coming From?
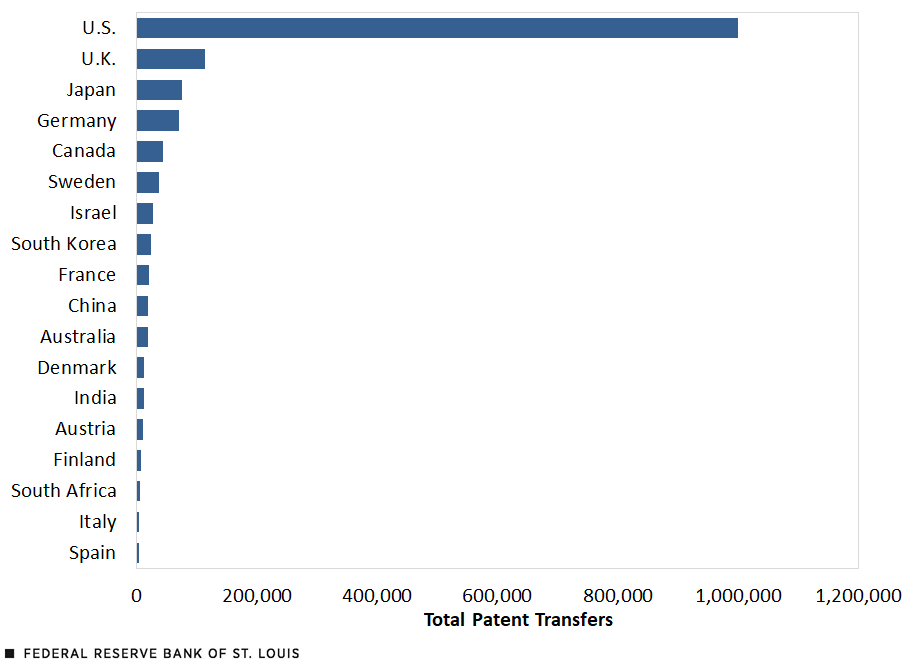
The figures below show the top origins of patents that are transferred internationally. Because of the issue of second-order transfers—tax schemes such as the double Irish with a Dutch sandwich—only transfers from non-tax haven origins are included. The figures show the total number of patents that were directly transferred internationally between 2001 and 2015.
Top 18 Originating Countries for Patent Transfers: 2001-15
Origins of Patent Transfers: 2001-15
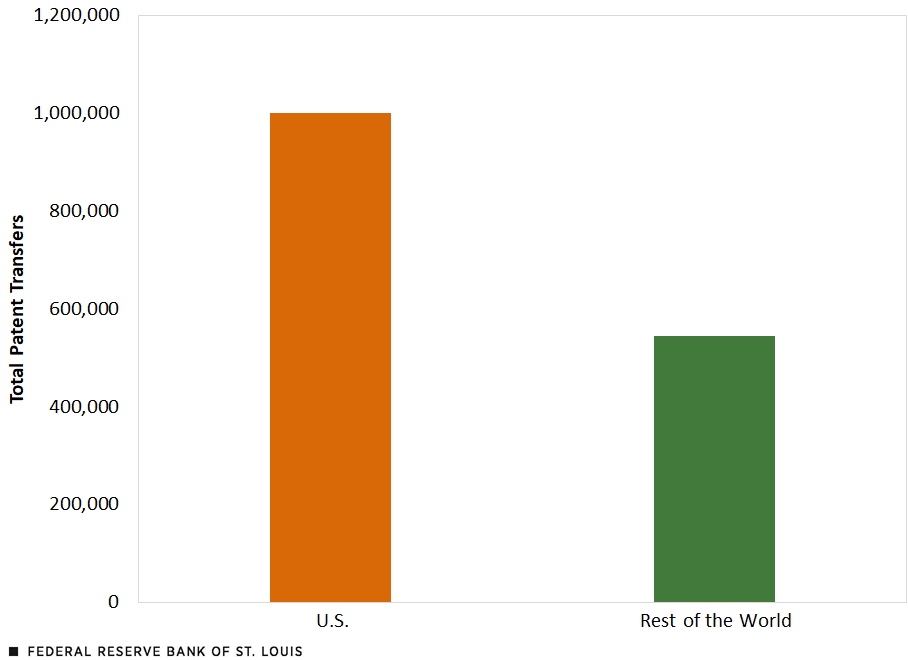
SOURCES FOR BOTH FIGURES: ktMINE and authors’ calculations.
NOTE FOR BOTH FIGURES: Data include only transfers from non-tax havens.
The U.S. sends by far the largest number of patents relative to other countries. In fact, as shown in the fourth figure, U.S.-based MNCs transferred more than all other non-tax haven countries combined between 2001 and 2015. Other countries that transfer a sizable number of patents include the United Kingdom, Japan, Germany and Canada, as shown in the third figure.
Where Are Patents Moving?
Where is ownership of these patents going? More specifically, are there countries that are receiving more of these transfers than would be expected given their size and production capabilities? The figure below shows the top destinations of these patent transfers during the same period. To account for a country’s relative size, patents are measured per 1,000 people in the destination country.
Top Destinations of Patent Transfers: 2001-15
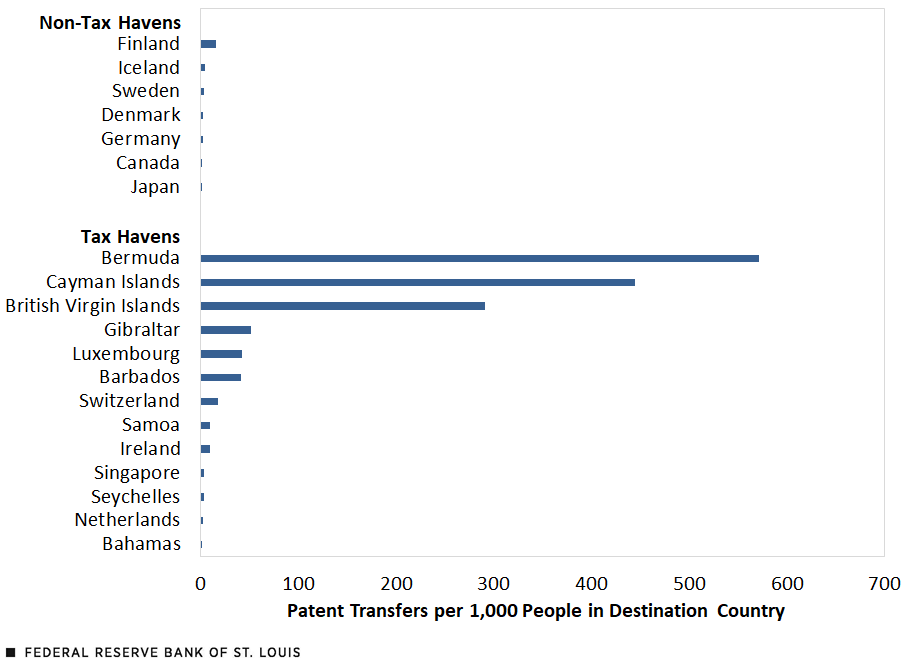
SOURCES: ktMINE and authors’ calculations.
NOTES: Data reflect only transfers from non-tax havens. This data set includes countries excluded in the first and second figures shown earlier in this blog post.
As shown in the figure above, countries with higher patent transfers per population tended to be tax havens. For example, Bermuda received nearly six hundred patent transfers per 1,000 people between 2001 and 2015. Patent transfers per capita are also notably large in other tax havens, including the Cayman Islands, the British Virgin Islands, Gibraltar, Luxembourg and Barbados. Therefore, these countries are receiving far more patents than could be explained by their countries’ size or economic output. This would suggest that patents are being transferred to these countries for reasons beyond economic activity, such as tax avoidance.
The evidence presented so far includes all patent transfers, so long as the patents originated in a non-tax haven country. Next, we investigate what share of these patent transactions are intrafirm.
Patent Transfers within Firms
Intrafirm patent transfers are transfers conducted within an MNC’s corporate tree; for example, the parent company of an MNC headquartered in the U. S. transfers a patent to an affiliated company in a Caribbean tax haven. Through a practice called “transfer pricing,” the parent company transfers IP to the affiliate below market price, typically at cost of production. The transfer lowers the revenue of the parent company and increases revenue in the lower-tax jurisdiction, allowing MNCs to reduce their tax burden without any overall financial impact on the MNC. Once ownership is transferred to the affiliate, the MNC can continue to shift profits through royalty payments paid by the parent company to the affiliate for continued use of the IP. These transfers are typically motivated by tax differences and are conducive of MNC tax evasion.
In the figure below, we calculate the share of patent transfers that are intrafirm for destination countries. Because of the large number of patents lost by the United States from 2001-15, we focus only on destinations of U.S.-originated patents.
Intrafirm Share among Top 20 Destinations with Highest per Capita of U.S. Patent Transfers

SOURCES: ktMINE and authors’ calculations.
For several of the tax havens shown in the previous figure (Bermuda, Luxembourg, Barbados and Switzerland), 50% to 80% of all incoming patent transfers during the period 2001-15 are intrafirm. Therefore, multinationals are transferring patents to satellite locations in these countries. As mentioned earlier, MNCs have a strong incentive to transfer IP to these jurisdictions to avoid taxes. While South Korea is an outlier among the developed world—a fact that requires further examination—other large, developed nations are all around 30%.
In summary, tax differences play a key role in where MNCs transfer their patents, specifically patents transferred within a corporate tree. During the sample period, the U.S. lost more patents than all other non-tax haven countries combined. Destinations of U.S.-originated patents with the largest number of patents per population also exhibited high percentages of intrafirm transfers. Our analysis emphasizes the importance of patent transfers and taxation for large multinational corporations, as well as the jurisdictions in which MNCs operate.


Citation
Mickenzie Bass, Ana Maria Santacreu and Jesse LaBelle, ldquoProfit Shifting in the 21st Century: Multinationals’ Use of Intrafirm Patent Transfers,rdquo St. Louis Fed On the Economy, Sept. 12, 2023.
This blog offers commentary, analysis and data from our economists and experts. Views expressed are not necessarily those of the St. Louis Fed or Federal Reserve System.
Email Us
All other blog-related questions