


A Cross-Country Look at Immigrant Earnings Gaps
Immigrant workers are an important part of the labor force in many countries. How do their earnings compare with those of native workers?
Serdar Birinci and Fernando Leibovici, both economists and economic policy advisors at the St. Louis Fed, and Kurt See, a principal researcher at the Bank of Canada, explored how immigrant earnings compared with those of native workers across countries in a January Economic Synopses essay. This investigation into immigrant earnings is part of their broader analysis of immigrant labor.For more on the authors’ previous research on immigrant labor, see their 2021 working paper (updated in June 2022) “The Allocation of Immigrant Talent: Macroeconomic Implications for the U.S. and across Countries” and their 2022 blog post “The Allocation of Immigrant Talent across Countries: Employment Gaps.”
Examining Differences across Countries, Occupations
The authors examined data for 19 countries that were derived from the Luxembourg Income Study. To determine cross-country differences in average earnings, they divided immigrant and native workers into four broad occupational groups:
- Nonroutine cognitive occupations, such as management and professional jobs
- Nonroutine manual occupations, such as health aide and food service jobs
- Routine cognitive occupations, such as retail sales and clerical jobs
- Routine manual occupations, such as construction and assembly jobs
Earnings Gaps for Nonroutine Cognitive Occupations
The figure below shows the percentage difference in earnings between immigrant and native workers in nonroutine cognitive occupations for the 19 countries.
Cross-Country Differences in Earnings between Immigrant and Native Workers: Nonroutine Cognitive Occupations
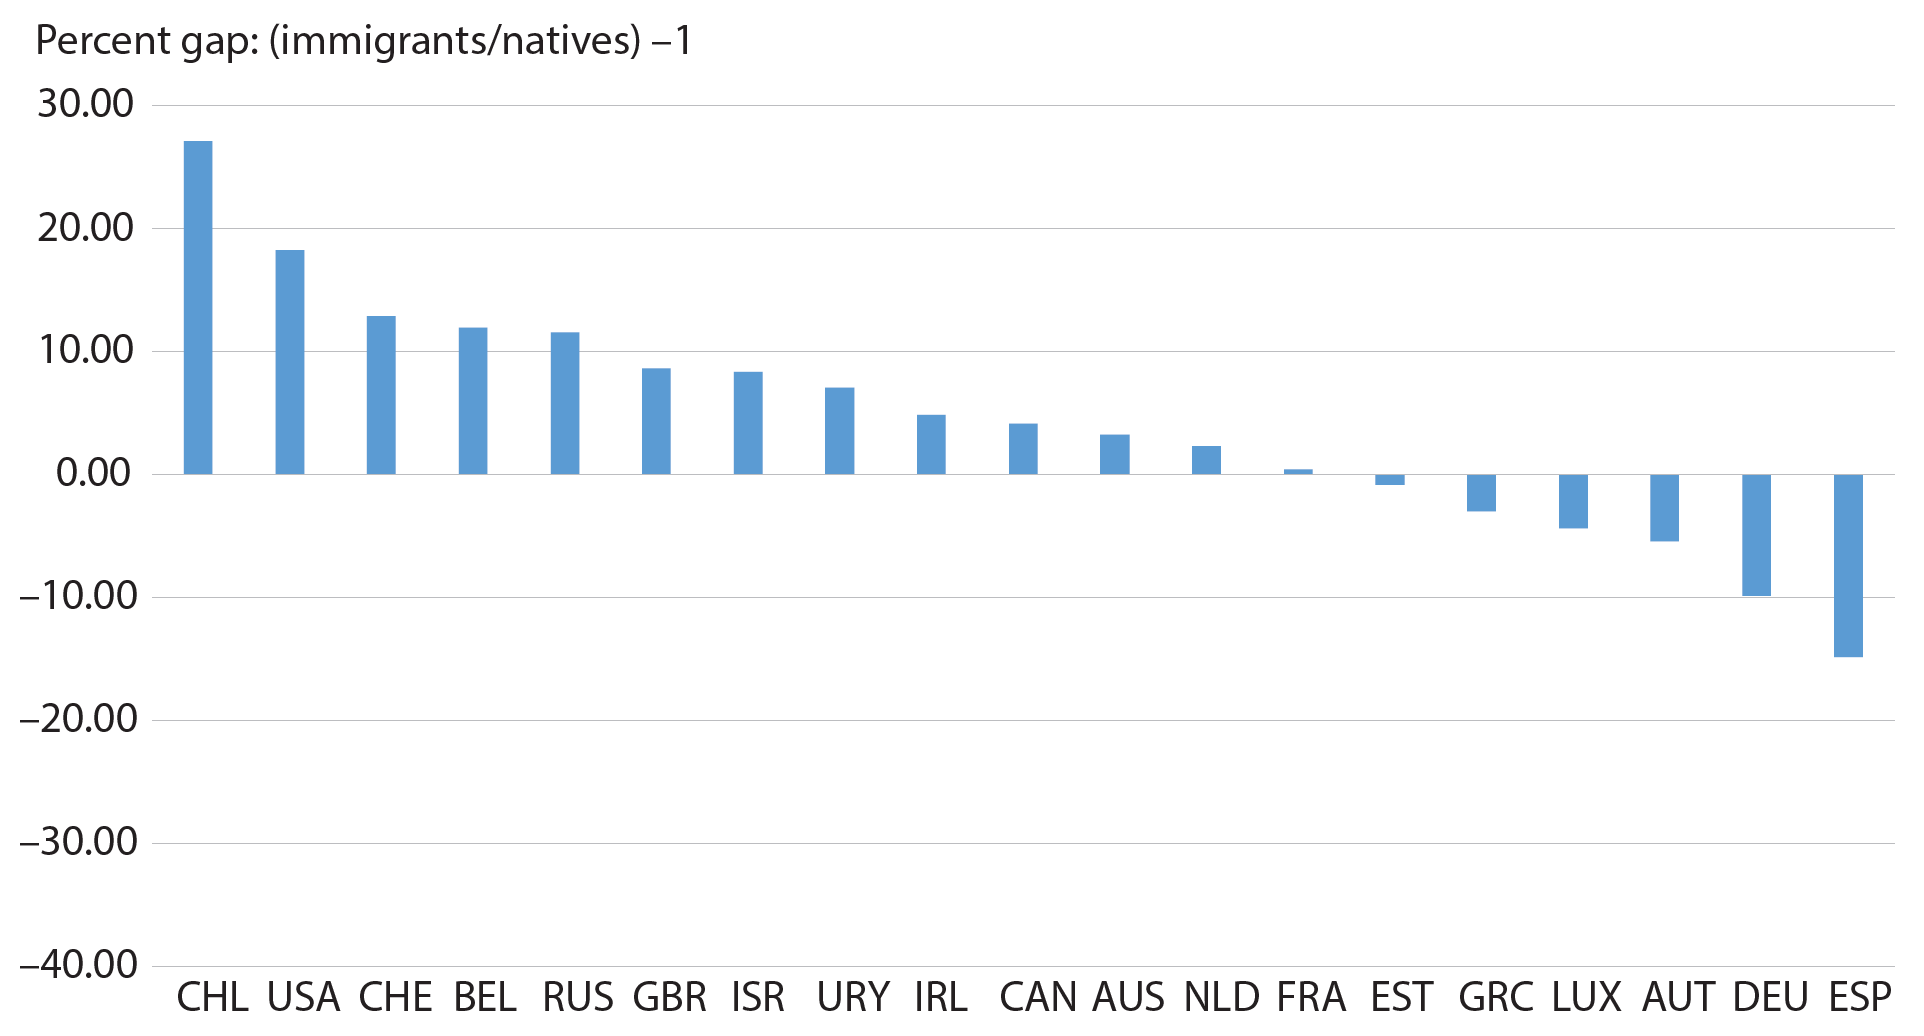
SOURCES: Luxembourg Income Study (LIS) database and authors’ calculations.
As shown in the figure, immigrant workers in occupations like medicine and engineering earned more on average than native workers in roughly two-thirds of the countries studied. In countries where these immigrant workers earned more than their native counterparts, the gaps were highest in Chile (with immigrants earning 27% more than natives in these jobs) and the U.S. (18%), the authors noted.
Citing their previous blog post, the authors pointed out that immigrants were underrepresented in this type of occupation but were overrepresented in lower-paying jobs—that is, manual occupations.
Earnings Gaps for Manual Occupations, Both Nonroutine and Routine
In terms of manual jobs (nonroutine and routine manual occupations), immigrant workers generally earned less on average than their native counterparts, the authors found.
“The magnitudes of these gaps, again, vary greatly by country: Immigrants trail in average earnings by anywhere from around 30% to less than 5%,” Birinci, Leibovici and See wrote.
The authors provided some examples of the differences. In nonroutine manual occupations, immigrants in the U.S., Germany and Canada earned, on average, 24%, 15% and 11% less than native workers, respectively. In routine manual occupations, immigrants in the U.S. and Germany were paid, on average, 19% and 6% less than native workers, respectively, while immigrants in Canada earned slightly more (1%) than natives, they noted.
(Figures related to the cross-country gaps for nonroutine and routine manual occupations can be found in their Economic Synopses essay.)
Earnings Gaps for Routine Cognitive Occupations
In routine cognitive occupations like retail sales, immigrant workers in the majority of the 19 countries studied earned less on average than their native counterparts, the authors found.
“Where immigrant workers earn less than native workers, earnings gaps are more diverse, ranging from 21% for Greece to about 3% for the US,” they wrote. “But where immigrants earn more than native workers, it is always by less than 10%.”
(The figure related to the cross-country gaps for routine cognitive occupations can be found in their Economic Synopses essay.)
Note
- For more on the authors’ previous research on immigrant labor, see their 2021 working paper (updated in June 2022) “The Allocation of Immigrant Talent: Macroeconomic Implications for the U.S. and across Countries” and their 2022 blog post “The Allocation of Immigrant Talent across Countries: Employment Gaps.”
Citation
ldquoA Cross-Country Look at Immigrant Earnings Gaps,rdquo St. Louis Fed On the Economy, Sept. 19, 2023.
This blog offers commentary, analysis and data from our economists and experts. Views expressed are not necessarily those of the St. Louis Fed or Federal Reserve System.
Email Us
All other blog-related questions