


Unlike Others, the Top Earners See Strong Pay Growth Beyond Age 35
In a blog post published earlier this year, I explored the large variation in lifetime earnings (LE) among male workers. That post, based on my research with economists Fatih Karahan and Jae Song, noted that one of the primary factors contributing to LE inequality was the vast differences in earnings growth throughout their careers.
In today’s blog post, I highlight other findings of our work.See Fatih Karahan, Serdar Ozkan and Jae Song’s paper “Anatomy of Lifetime Earnings Inequality: Heterogeneity in Job Ladder Risk vs. Human Capital” in the Journal of Political Economy-Macroeconomics, September 2023. An earlier working paper can be found on the St. Louis Fed website. I delve into the specific phases of male workers’ careersOur research focused on men because of the difficulties in getting uninterrupted earnings histories for women. during which they experience the most rapid increases in earnings, and analyze whether these patterns are similar for low- and high-income workers. In particular, I examine the timing and magnitude of earnings growth throughout working life across different income groups.
Average Earnings over the Lifecycle
The data on earnings histories of male workers are sourced from their W-2 tax forms and made available by the U.S. Social Security Administration. Our analysis is based on a sample of these wage and salary male workers with strong labor market attachment from 1978 to 2013.For additional in-depth information, refer to Karahan, Ozkan and Song’s 2023 article or their 2022 working paper. We computed LE as the average of individuals’ wage and salary income over the ages of 25 to 55. We then used this measure to rank workers into 50 equally sized quantiles.
In the U.S., there is large disparity in the lifetime earnings of workers. For example, individuals at the bottom end of the LE distribution earn approximately $15,000 annually (adjusted for 2005 dollars) throughout their working lives. In contrast, the same figure increases to about $50,000 for median workers and further escalates steeply to about $400,000 for the top 2% earners.
The figure below illustrates the average earnings between ages 25 and 55 of individuals in the bottom 2%, median and top 2% of the LE distribution.
Lifetime Earnings Distribution
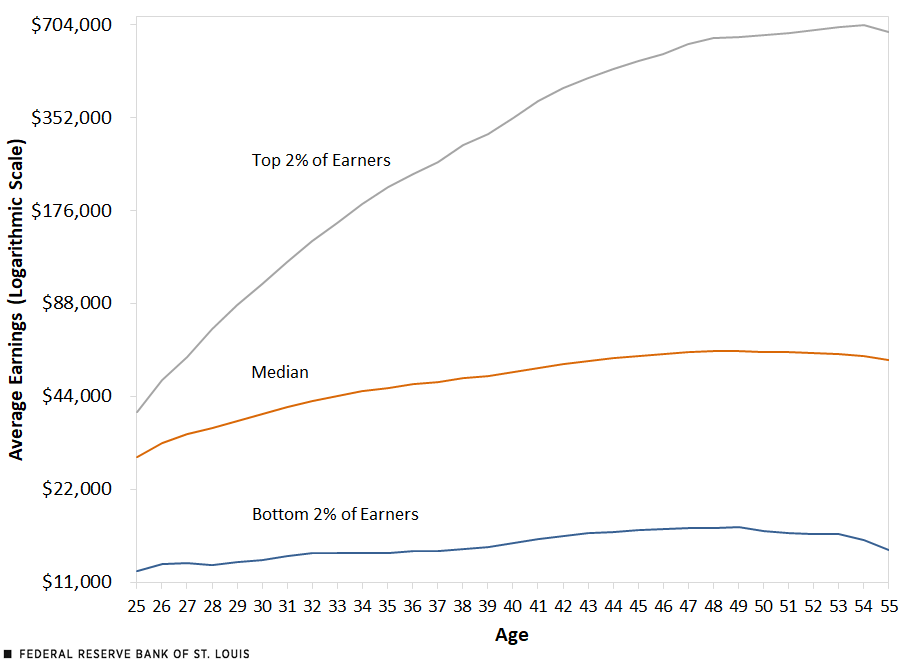
SOURCE: Karahan, Ozkan and Song, 2023.
NOTE: Average annual earnings are in 2005 dollars.
Income inequality is evident right from the outset of working life. At age 25, individuals in the lowest LE bracket earned an average of approximately $12,000, while those in the median and top brackets earned $28,000 and $39,000, respectively. As a result, the earnings gap between the highest and lowest earners—measured as the ratio of their average earnings—already stands at around 3.25 at the beginning of their working lives.
Nevertheless, as we fast forward a decade to age 35, these distinctions become significantly more pronounced. Those at the top of the LE distribution witness a remarkable 435% surge in their incomes between ages 25 and 35. In contrast, median earners undergo a comparatively modest increase of over 65%, while those at the bottom experience minimal earnings growth, a mere 16% uptick. Consequently, the earnings gap between the highest and lowest earners increases to 15.3 (i.e., the top LE workers earned 15.3 times as much as the bottom LE workers).
Interestingly, during the subsequent 10-year period (ages 35-45), the median LE group witnesses a significant deceleration in their earnings growth, plummeting from the previous decade’s 65% increase to approximately 15%. Meanwhile, the bottom LE group continues to undergo a gradual but consistent earnings growth of around 15%. As usual, the top LE group deviates substantially from the rest of the workforce. They once again experience an astonishing surge in earnings, exceeding 150%, and by the time they reach age 45, they earned more than half a million dollars annually. Consequently, the earnings gap between the highest and lowest earners widens further, expanding from 15.3 to 33.1.
Bottom 2% and Median Worker See Earnings Decline after Age 50
During the final decade of their careers, earnings growth continues to decelerate for all workers but more so for the bottom and median LE groups. Actually, average earnings for these two groups peak at around age 50, while the top LE group continues to enjoy a gradual and consistent earnings increase almost until age 55.
Between ages 45 and 55, the bottom earners experience a notable decline of 14% in their average earnings, essentially erasing the gains made during the preceding decade. As for the median LE group, their earnings decline modestly by around 3%. Once again, the top earners stand apart from the rest of the workforce, achieving an additional 25% earnings growth during the same period. In turn, the earnings gap between the bottom and the top earners reaches an astonishing ratio of 47.8.
Unlike Others, Top 2% Continues to See Strong Earnings Growth Beyond First Decade
For most workers, the bulk of their earnings growth occurs within the initial decade of their careers. Beyond age 35, their incomes exhibit minimal growth or even plateau. In contrast, high-earning individuals continue to witness income increases, albeit at a declining pace, extending until age 55. Consequently, the income disparity between these top earners and the remainder of the workforce continues to widen over their working lives.
Notes
- See Fatih Karahan, Serdar Ozkan and Jae Song’s paper “Anatomy of Lifetime Earnings Inequality: Heterogeneity in Job Ladder Risk vs. Human Capital” in the Journal of Political Economy-Macroeconomics, September 2023. An earlier working paper can be found on the St. Louis Fed website.
- Our research focused on men because of the difficulties in getting uninterrupted earnings histories for women.
- For additional in-depth information, refer to Karahan, Ozkan and Song’s 2023 article or their 2022 working paper.

Citation
Serdar Ozkan, ldquoUnlike Others, the Top Earners See Strong Pay Growth Beyond Age 35,rdquo St. Louis Fed On the Economy, Oct. 16, 2023.
This blog offers commentary, analysis and data from our economists and experts. Views expressed are not necessarily those of the St. Louis Fed or Federal Reserve System.
Email Us
All other blog-related questions