The Fed’s Remittances to the Treasury: Explaining the 'Deferred Asset'
The Federal Reserve has a dual mandate from Congress of price stability and maximum sustainable employment. Additionally, the Fed strives to preserve financial stability as a necessary condition to fulfill its mandate. During the course of pursuing these goals, the Federal Reserve generates income from interest earned on securities acquired through its open market operations; it also receives fee-based income for its services. Typically, this income exceeds the cost of operations. By law, the Fed turns over excess earnings to the U.S. Treasury as remittances.
However, what happens when the Fed’s income does not exceed its operating costs? This does not affect the Fed’s ability to conduct monetary policy or to meet its financial obligations. But it does have implications for excess earnings transfers between the Fed and the Treasury, as this blog post explains.
The Tightening Cycle and Remittances
Previously, Miguel Faria e Castro discussed remittances from the Fed to the Treasury in the context of the post-financial crisis tightening from 2015 to 2018. In that 2018 blog post, Faria e Castro explained that increasing policy rates could reduce the Fed’s net earnings through two main channels: by raising the Fed’s costs directly, via interest paid on banks’ excess reserves held at the Fed, and by reducing the interest income earned on securities owned via a balance sheet reduction (as fewer securities means fewer sources of interest rate income).
This tightening cycle was interrupted in the summer of 2019, when the Fed began to lower the federal funds rate target. The easing continued with the emergence of the COVID-19 pandemic and the associated economic emergency. As part of the monetary policy response to this event, the Fed lowered this interest rate to near zero and resumed the expansion of its balance sheet via asset purchases.
Two of the important policy rates the Fed controls are the federal funds rate and the interest rate on reserve balances (IORB rate). Since March 2022, the Fed has raised the target range for the federal funds rate from 0.0%-0.25% to 5.25%-5.5%, and the IORB rate from 0.15% to 5.4% in an effort to bring inflation back down to the Fed’s 2% target.
In this blog post, we update the analysis from Faria e Castro’s 2018 post and focus on the current tightening cycle, during which the Fed’s net income has become negative.
Federal Reserve Income Statement
The Federal Reserve can earn revenue in a couple of ways. First, the Fed generates interest income from its purchased assets, such as agency mortgage-backed securities and Treasury securities. Second, the Fed charges banks regulatory and supervisory fees.
The Fed also incurs three types of costs: payments of interest on reserve balances, payments of interest on securities sold under agreements to repurchase (reverse repo) and operational costs (payroll, for example).
We can think of the Fed’s net income as being, roughly, equal to the product of the net interest rate spread (the difference between the interest rate earned on assets and the interest rate paid on liabilities) and the size of the Fed’s balance sheet. Monetary policy tightening can reduce net income by reducing each of these components individually.
First, tightening causes the net interest rate spread to fall; that is, it causes net income to fall for a constant size of the Fed’s balance sheet. This occurs because the Fed runs a maturity mismatch: It owns long-term securities and owes short-term liabilities. Specifically, when the Fed raises the policy rate, it is immediately paying more interest on bank reserves and reverse repos—a large portion of the Fed’s liabilities: 42.5% and 17.0%, respectively, as of Nov. 8, 2023. However, the Fed’s assets are longer-term and often pay a fixed interest rate. Therefore, when the Fed raises the policy rate, its net interest rate spread falls.
Tighter monetary policy also tends to be associated with a reduction in the size of the Fed’s balance sheet. For a given (positive) net interest rate spread, this reduces the absolute value of net income. Some critics have voiced concern about capital losses on the Fed’s balance sheet, as longer-term assets have positive duration and therefore lose value when interest rates rise. However, the Fed does not mark to market its balance sheet.Mark to market is a term used in financial reporting that refers to the practice of constantly updating the value of assets based on current market values, even if they are held to maturity. This is because the Fed does not actively trade securities and only holds them until maturity. Thus, only flow income from securities matters for the Fed’s net earnings.
Recent Trends in Net Income
The Fed’s current tightening cycle has been faster than any other tightening cycle in the last 40 years in an effort to return inflation to its 2% target.Juan M. Sánchez and Olivia Wilkinson recently covered the tightening episodes since 1990. This rapid increase in the policy rates has led to a corresponding increase in the Fed’s interest costs, while its interest income has adjusted much more slowly. As a result, the Fed’s operating costs began to exceed its income as of September 2022.
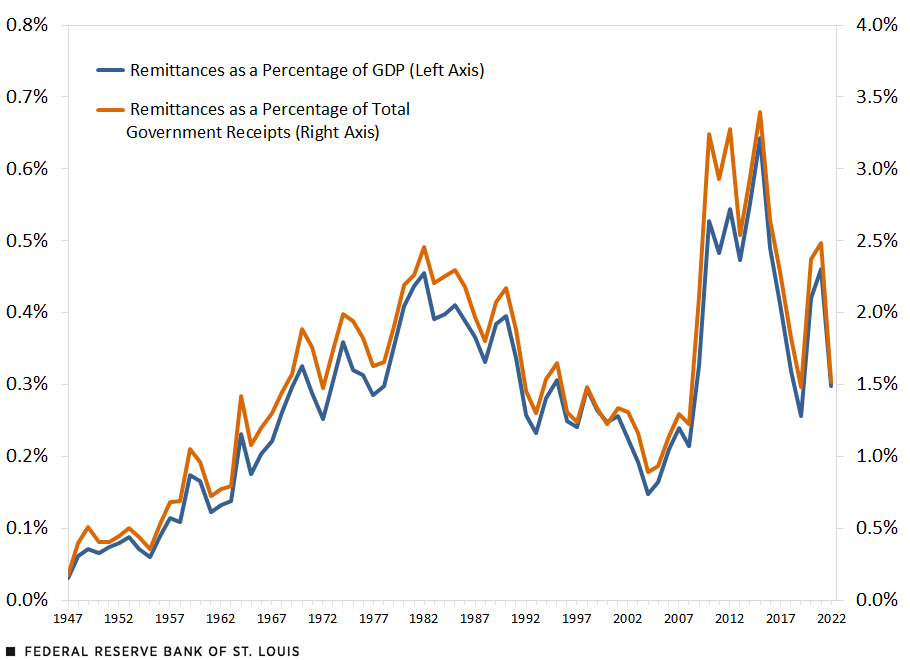
The figure below plots Fed remittances to the Treasury at an annual frequency, relative to gross domestic product (GDP) and to total government receipts, since 1947.
Federal Reserve Transfers to the U.S. Treasury

SOURCES: Federal Reserve Board of Governors press releases (remittances due after 2014), Bureau of Economic Analysis (remittances before 2014, GDP and federal receipts, all accessed via FRED) and authors’ calculations.
One can see that remittances rose considerably in the aftermath of the balance sheet expansion following the global financial crisis of 2007-08; they went from 0.2% of GDP and 1.3% of government receipts in 2007 to 0.6% and 3.4%, respectively, in 2015.
Remittances then fell due to the 2015-18 tightening cycle, but they rose again in 2020 as the Fed slashed interest rates and resumed its balance sheet expansion (additionally, GDP fell in 2020, which partly explains the positive jump). Between 2021 and 2022, remittances as a percent of GDP dropped from 0.5% to 0.3%. This is in part due to remittances declining by about $30 billion and GDP increasing by more than $2 trillion.
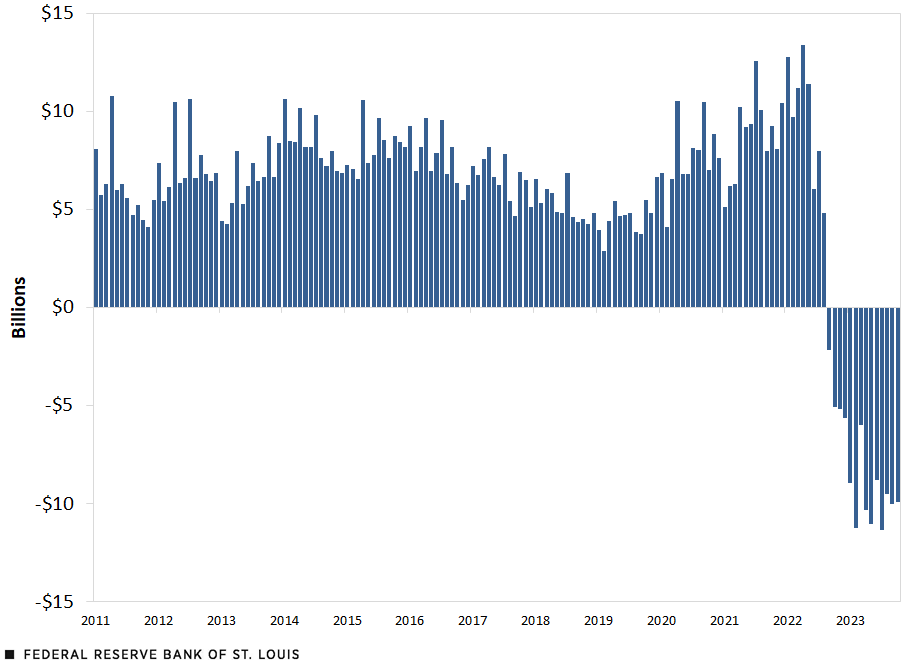
Next, we show the monthly summation of remittances due to the Treasury. (See the figure below.) For most of the past decade, the Fed remitted between $5 billion and $10 billion per month to the Treasury. In fact, between 2011 and 2021, the Fed’s remittances totaled over $920 billion. However, beginning in September 2022, remittances due became negative. Since then, the Fed has experienced a shortfall in earnings that is generally between about $5 billion and $11 billion per month.
Monthly Remittances Due

SOURCES: Federal Reserve Board of Governors H.4.1 releases (accessed via FRED) and authors’ calculations.
NOTE: Starting in September 2022, the monthly number is based on the sum of the weekly increases in the deferred asset for the reported month rather than the total accumulated value of the deferred asset. For about this time series, see this FRED blog post.
The Fed’s Negative Liability, or “Deferred Asset”
As discussed, when the Fed’s income exceeds its costs, it sends the excess earnings to the Treasury. But what happens when its costs exceed its income? In this case, the Fed creates a “deferred asset,” which is a negative liability whose value is the cumulative value of the shortfall in earnings. Once the Fed returns to earning a positive net income, it will pay down the value of the deferred asset until it reaches zero, at which point the Fed will resume sending remittances to the Treasury. As of Nov. 8, 2023, the Fed had accumulated a deferred asset of $116.9 billion. In April 2023, the New York Fed estimated that the Fed will return to positive net income in 2025.See Chart 34 in the 2022 Annual Report of the System Open Market Account (PDF), published by the Federal Reserve Bank of New York in April 2023. The chart data (XLSX) are also available online. Combining those New York Fed projections with the latest data on net income, we estimate that the Fed will carry this deferred asset until mid-2027, after which it will resume transfers to the Treasury.
In conclusion, tighter monetary policy to rein in inflation has resulted in a reduction of net income for the Fed. This does not mean that the Treasury has to recapitalize the Fed, but rather that the Fed records a negative liability in the form of a deferred asset. This deferred asset accumulates until the Fed sees positive net income, which should happen once interest rates on the long-duration assets it owns start exceeding the interest paid on bank reserves and reverse repo facilities.
Notes
- Mark to market is a term used in financial reporting that refers to the practice of constantly updating the value of assets based on current market values, even if they are held to maturity.
- Juan M. Sánchez and Olivia Wilkinson recently covered the tightening episodes since 1990.
- See Chart 34 in the 2022 Annual Report of the System Open Market Account (PDF), published by the Federal Reserve Bank of New York in April 2023. The chart data (XLSX) are also available online.
Citation
Miguel Faria-e-Castro and Samuel Jordan-Wood, ldquoThe Fed’s Remittances to the Treasury: Explaining the 'Deferred Asset',rdquo St. Louis Fed On the Economy, Nov. 21, 2023.
This blog offers commentary, analysis and data from our economists and experts. Views expressed are not necessarily those of the St. Louis Fed or Federal Reserve System.
Email Us
All other blog-related questions


