


Which Households Are Most Exposed to the Inflation “Tax”?
In a previous blog post, we analyzed how much people are implicitly “taxed” by inflation due to nominal borrowing and lending. When inflation is much higher than expectations at the time an agreement is entered, it is effectively a transfer of wealth from the lender to the borrower. Such is the case with the largest borrower in the United States—the federal government—and the lenders—owners of Treasury securities. An interesting aspect of this is that many lenders might not be aware of their exposure to this implicit tax. A lot of Treasury securities are held indirectly, so the channel through which a household is “taxed” might not be immediately clear.
In this blog post, we study domestic households as the lenders to the U.S. government and through which channels they have held securities. This ownership is quite relevant during inflationary episodes, such as in 2022.
How Do Lenders Lend?
We combined Survey of Consumer Finances (SCF) data with Flow of Funds data to document holdings of Treasury securities in 2019 among U.S. households. There are two ways to hold Treasuries. First, you can hold them by purchasing Treasury bills, notes or bonds directly from the U.S. Department of Treasury or via a secondary market. Second, a less visible channel of ownership (but a more common method, as we’ll see) is the Treasuries you hold indirectly through pension funds, mutual funds, money market funds, noncorporate business holdings (such as a limited liability company) and corporate equity.
What is the most common method of Treasury ownership? In the first figure, we show how the Treasuries are held by each age group.
The Composition of Treasury Ownership in 2019, by Age Group
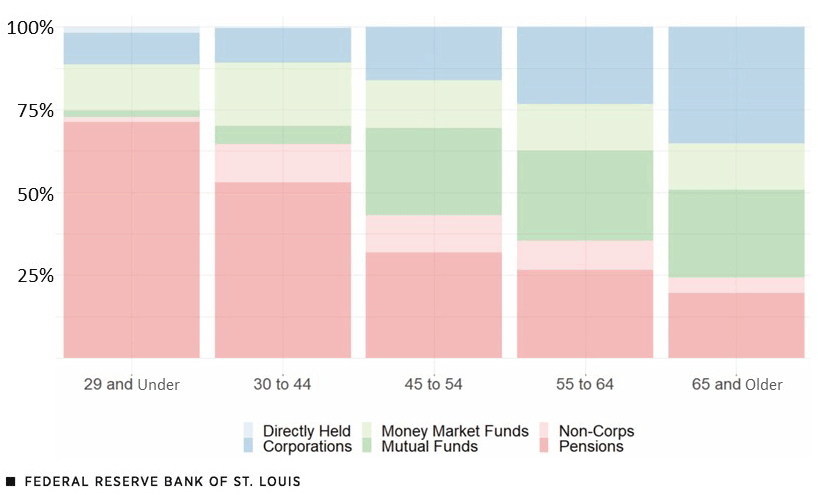
SOURCES: 2019 Survey of Consumer Finances, Flow of Funds and authors’ calculations.
NOTES: This figure shows, for each age group, the breakdown of the different ways of holding Treasuries. In the legend, the “Corporations” category is corporate equity and the “Non-Corps” category is noncorporate business holdings. Age is based on the age of the respondents in the SCF survey. For those under 30, nearly 75% of their Treasury ownership is indirectly held via pension funds. As households age and accumulate different assets, this number drops to roughly 20% by age 65+. For the youngest group, about 10% of Treasury ownership is indirectly held through corporate equities; slowly rising with age, the number reaches roughly 35% for the oldest group.
Direct holdings of Treasuries may be the most visible way a household sees its holdings devalued (or “taxed”) by inflation, but as alluded to previously, this is not the most common way to be harmed by this implicit tax. In fact, direct holdings of Treasuries are a relatively insignificant form of Treasury holdings, accounting for between less than 1% and 2% across the age groups.
Most households hold Treasuries indirectly. For example, if a household holds $10,000 in the pension fund, and the pension fund holds 20% of its value in the Treasury, then the household indirectly holds $2,000 in the Treasury. Pension funds are an important channel through which households hold Treasuries. As shown in the first figure, pensions make up a large portion of Treasury holdings for every age group, including more than 50% for households under 45 years old. As households get older, their Treasury exposure through pensions shrinks; their holdings of Treasury debt are mostly through corporate equity, mutual funds and money market mutual funds. This reflects that, on average, households accumulate more assets through these other channels as they age.Our analysis of Treasury holdings by intermediary accounts for the fact that some intermediaries own one another. In other words, pensions may hold money market funds, which may hold Treasuries.
Who Has the Most to Lose?
In the second figure, we split out households by their wealth quintiles in their respective age groups. For each wealth-age group, we divide the total Treasury holdings by the total net wealth.
Share of Net Wealth Held in Treasuries in 2019, by Age Group
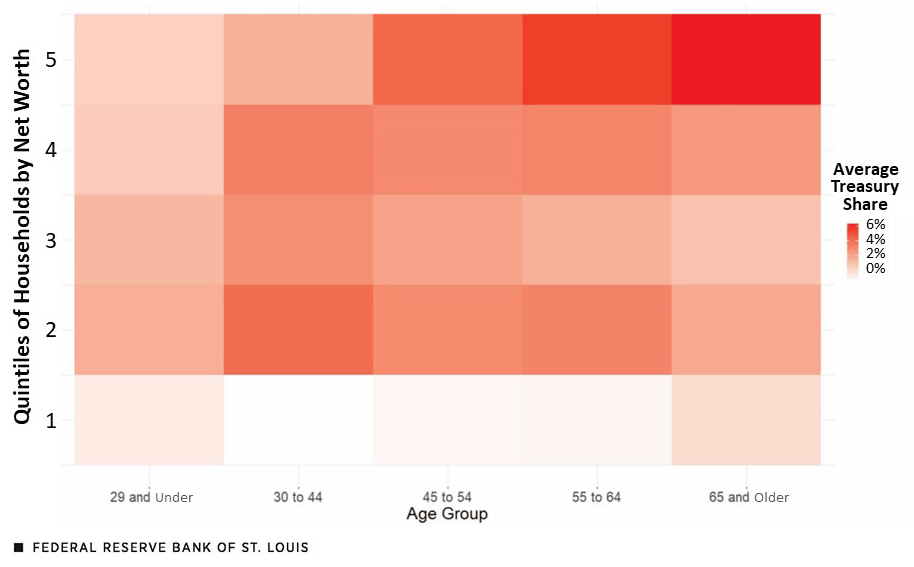
SOURCES: 2019 Survey of Consumer Finances, Flow of Funds and authors’ calculations.
NOTES: This heat map shows, for each age group and quintile of households by net wealth, the share of the average Treasury holdings divided by average net wealth. The first quintile had lowest net worth and the fifth has the highest net worth. The wealthiest households who are 65+ have 6% of their wealth in Treasury securities, both directly and indirectly held. This is the highest share among all the quintiles and age groups.
For households in the top wealth quintile, Treasuries become a more important element of their balance sheets, topping at 6% for the oldest and wealthiest group (the fifth quintile). However, for the second to fourth wealth quintiles, holdings of Treasuries as a share of net worth tend to fluctuate with age: increasing from the 20s age group to middle age, but then decreasing gradually. This transition likely reflects the change in household asset holdings over the life cycle.
We can interpret the numbers in the second figure as showing how much households’ wealth in each group is exposed to the implicit inflation tax through their Treasury holdings. Overall, the older, wealthiest households and the groups that are both middle-aged and middle wealth seem to be the most exposed.
Conclusion
Determining which lenders to the U.S. government are hurt the most by the inflation tax is complex. It is not as simple as looking at the direct Treasury holdings of different groups. We account for households’ indirect holdings to understand through which channels and by how much households are exposed to this kind of implicit tax.
Note
- Our analysis of Treasury holdings by intermediary accounts for the fact that some intermediaries own one another. In other words, pensions may hold money market funds, which may hold Treasuries.


Citation
Yu-Ting Chiang and Jesse LaBelle, ldquoWhich Households Are Most Exposed to the Inflation “Tax”?,rdquo St. Louis Fed On the Economy, June 27, 2023.
This blog offers commentary, analysis and data from our economists and experts. Views expressed are not necessarily those of the St. Louis Fed or Federal Reserve System.
Email Us
All other blog-related questions