


Marginal vs. Average Mortgage Rates
Since early 2022, the Federal Open Market Committee has increased the target range for the federal funds rate from 0%-0.25% to 5%-5.25%. The higher fed funds rate has driven up interest rates on financial instruments (e.g., Treasury bonds, certificates of deposit and corporate bonds) and loans. Perhaps most notably for everyday households, the 30-year fixed-rate mortgage rose above 6% for the first time since the Great Recession. During the pandemic, many households sought to upgrade their living situations, leading to high demand for housing, and thus demand for mortgages.
The 30-year fixed-rate mortgage is by far the most popular in the U.S.—70% of mortgages are 30-year fixed rate. The 15-year fixed-rate mortgage is the second-most popular with 10%. The remaining 20% is made up of various adjustable-rate mortgages and some shorter-term fixed-rate mortgages. For the remainder of this blog post, we will focus on the 30-year fixed-rate mortgage.
The Marginal Rate vs. the Average Rate
A consumer who has a mortgage knows how much he or she is paying in interest. However, economists want to consider the entire economy to determine the impact on the average consumer. We define the marginal rate as the mortgage rate you would pay if you went to the bank today and asked for a loan. However, most people aren’t paying that rate. Given the duration of mortgages, individual rates get locked in for the life of the loan, and thus there is a wide range of rates people are paying.
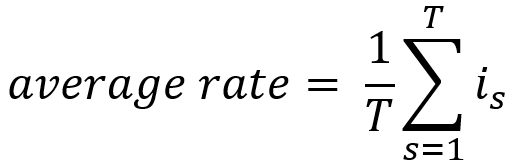
We construct the average rate assuming an equal number of people get mortgages every month, with no opportunity to refinance. For example, the average, nominal 30-year fixed mortgage rate today is a simple average of the monthly marginal rates, i subscript s, from April 1993 to March 2023. We compare the marginal rate to the average rate over time. We calculate the average rate only for periods for which we have 30 years of prior data available.
Refinancing
Refinancing in the mortgage market is commonplace. Because of the long maturities of mortgages, there will be periods with low rates and periods with high rates. Typically, refinancing is done with the purpose of securing a lower interest rate, and thus it takes place when current mortgage rates are low. When you refinance a mortgage, you essentially apply for a new mortgage—at the market rate—and once that mortgage is granted, you use the money from the new mortgage to completely pay off the old mortgage. Thus, you are left with a new mortgage at a lower interest rate.
You benefit from refinancing a loan because you refinance only when rates are lower. When you get an initial mortgage, the rate will likely change the next day. If the initial mortgage were 6% and it went up to 8%, you would pay 2 percentage points less than the marginal rate. If it went down to 4%, you would pay 2 percentage points more, but you could refinance to the 4% rate.
We consider two possible measures of the average rate. First, the rate described above—with no refinancing. This rate will be an upper bound as to the true average rate, because in the real world many consumers will refinance to lower rates, bringing down the average rate.
Second, we consider the average rate with refinancing. For this rate, we assume that consumers refinance their mortgages in any period when the current rate is lower than their existing rate. This rather strong assumption implies that there are no transaction costs to refinancing. Thus, the average rate with refinancing provides a lower bound for the true average rate, because in the real world it takes time to refinance, and you may have to pay fees for refinancing.
Since the data for our analysis start in 1971, our calculated values for the 30-year average rate start in 2001. For nearly the entire duration for which we measure the average rate, it is higher than the marginal rate, as shown in the figure below. This is because high mortgage rates in the ’70s and ’80s increased the average significantly. Only recently did the marginal rate overtake the average. Meanwhile, the average rate with refinancing is always lower or equal to the current marginal rate.
30-Year Fixed Mortgage: Marginal vs. Average Nominal Rates
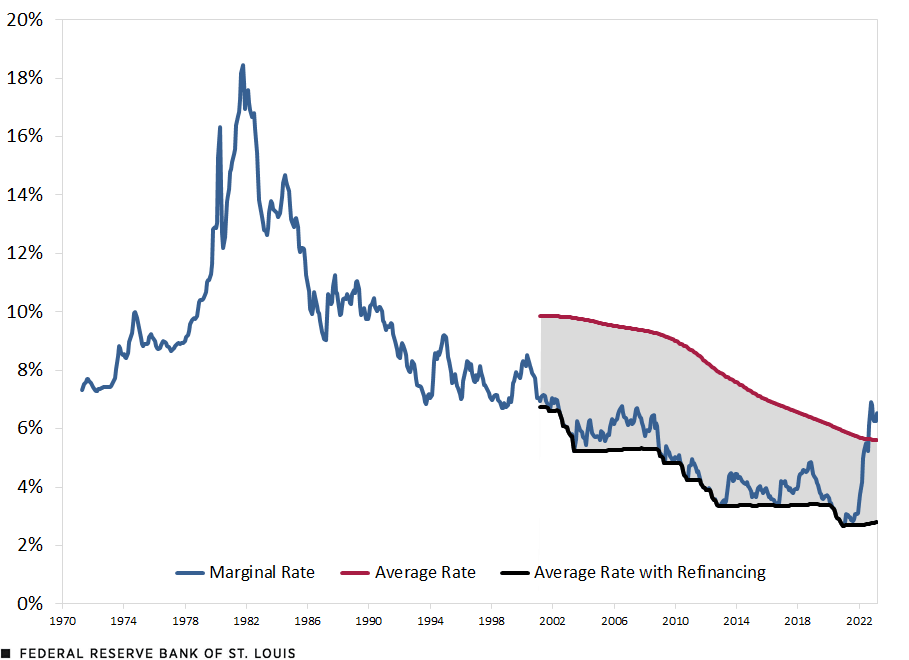
SOURCES: FRED and authors’ calculations.
NOTE: The shaded area represents the area bounded between the average rate and the average rate with refinancing.
Real Rates
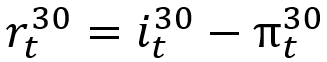
Inflation has recently been high, reminding us that it is important to consider not only nominal rates but real (or inflation-adjusted) rates as well. For each period t, we calculate the marginal real 30-year fixed mortgage rate, r, by taking the difference between the nominal rate, i subscript t with superscript 30, and the 30-year expected inflation rate, pi subscript t with superscript 30 :
Calculating the average real rate is slightly more complicated. We continue with the assumption that an equal number of mortgages are issued every period. However, a mortgage that was issued 28 years ago is associated with a different expected inflation than one that was issued two years ago. We define the average real rate without refinancing in the following equation, where the average real mortgage rate in time t, r overline subscript t with superscript T, is the average of the nominal rates, i subscript t minus 2 with superscript T, for the last T periods, given the T−s years expected inflation, pi subscript t, T minus s :
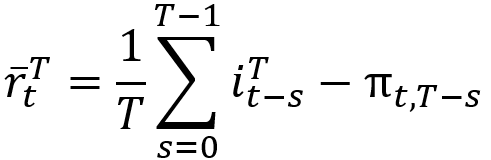
Thus, at s=0, which represents today, the real rate is the nominal rate today minus the 30-year expected inflation. The expected inflation, pi subscript t, T minus s, represents what we expect today, in time t, the average inflation to be during the next T−s years. When s=0, we use the average inflation expected during the next 30 – 0, or 30, years. At s=1, which represents one year ago, there are 29 years left to mature on that mortgage.In this example, we use an annual frequency. In our average real rate calculation, however, we use a monthly frequency. Since inflation data are only available at the annual frequency (one-year, two-year, etc.), we utilized a ceiling function to determine which value for expected inflation to use. For example, we use one-year expected inflation for 1-12 months and two-year expected inflation for 13-24 months. Therefore, the real rate today, on a security from one year ago, is what we expect today that the average inflation will be during the next T−s, or 29, years subtracted from the nominal rate one year ago.
When refinancing, consumers consider the nominal rate they are paying. Thus, we use the same refinancing strategy: Consumers with mortgages from each period will refinance whenever the current nominal rate is lower than the existing rate on their mortgages. Then we use the refinanced nominal rates to calculate the real rate as described above.
30-Year Fixed Mortgage: Marginal versus Average Real Rates
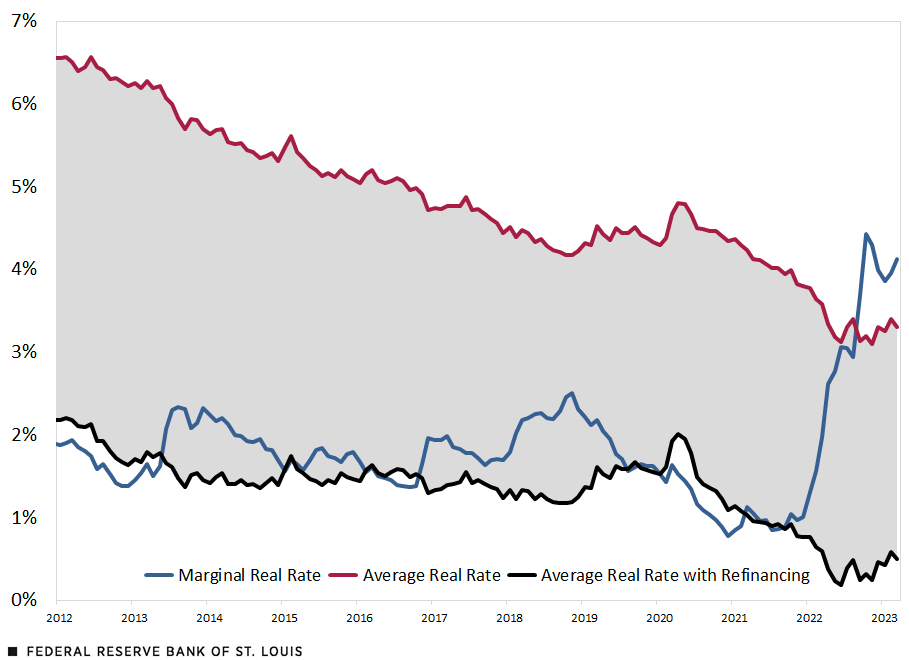
SOURCES: Federal Reserve Bank of Cleveland, FRED and authors’ calculations.
NOTE: The Cleveland Fed’s expected inflation data starts in 1982. Thus, our average real rate begins in 2012, when thirty years of prior data is available.
For real rates, you can see in the figure above that the average real rate with refinancing is not always lower than the marginal rate, as was true with the nominal rates. This is because during certain periods the expected inflation for the one- to 30-year expectations averaged less than the 30-year expectation.
We see that with refinancing or without refinancing, the average real rate for the past year has been less than the marginal rate being paid on the 30-year fixed-rate mortgage. While marginal rates are high today, we estimate that the average consumer with a mortgage is paying, in real terms, between one and four percentage points less than someone getting a mortgage today. Thus, the aggregate pressure on household finances from the high marginal rate today is low but will continue to increase the longer marginal mortgage rates stay high.
Note
- In this example, we use an annual frequency. In our average real rate calculation, however, we use a monthly frequency. Since inflation data are only available at the annual frequency (one-year, two-year, etc.), we utilized a ceiling function to determine which value for expected inflation to use. For example, we use one-year expected inflation for 1-12 months and two-year expected inflation for 13-24 months.


Citation
Julian Kozlowski and Samuel Jordan-Wood, ldquoMarginal vs. Average Mortgage Rates,rdquo St. Louis Fed On the Economy, June 1, 2023.
This blog offers commentary, analysis and data from our economists and experts. Views expressed are not necessarily those of the St. Louis Fed or Federal Reserve System.
Email Us
All other blog-related questions