How Mortgage Repayments Recovered since COVID-19’s Onset
The onset of COVID-19 and the accompanying efforts to control the pandemic created huge shocks in the U.S. economy. How did the pandemic affect repayment rates on mortgages?
A June 2022 Regional Economist article by St. Louis Fed economist and Vice President Juan M. Sánchez and Research Associate Olivia Wilkinson examined how repayment rates varied by levels of pre-pandemic financial distress. They also looked at how those challenges might have impacted foreclosure rates.
Financial Distress Before COVID-19
To determine the different levels of financial distress, the authors used a 2019 study (PDF) that broke down U.S. ZIP codes into quintiles based on the portion of households that were at least 30 days delinquent on credit card payments.
“In the least financially distressed quintile (the first quintile), an average of 7.4% of households were 30 days or more late on their credit card payments. The most financially distressed quintile (the fifth quintile) averaged 18.6%,” Sánchez and Wilkinson wrote. “Further, the least financially distressed quintile had nearly three times the income, more than double the median home value, and almost triple the mortgage debt as the most financially distressed quintile.”
The authors stated that, on average, 3.2% of homeowners in the least financially distressed group used more than 80% of their credit limit compared with 11.3% of homeowners in the most financially distressed group.
“This last indicator is crucial to understanding pre-pandemic differences among homeowners across quintiles in access to credit to respond to potential shocks,” they wrote.
Breaking Down Mortgage Repayment Rates
The authors studied how mortgage repayment rates changed for different groups since the start of the pandemic. They used a random sample of loan-level data from Black Knight McDash—a real estate data firm that issues monthly loan reports—along with the first and fifth quintiles of financial distress data cited above.
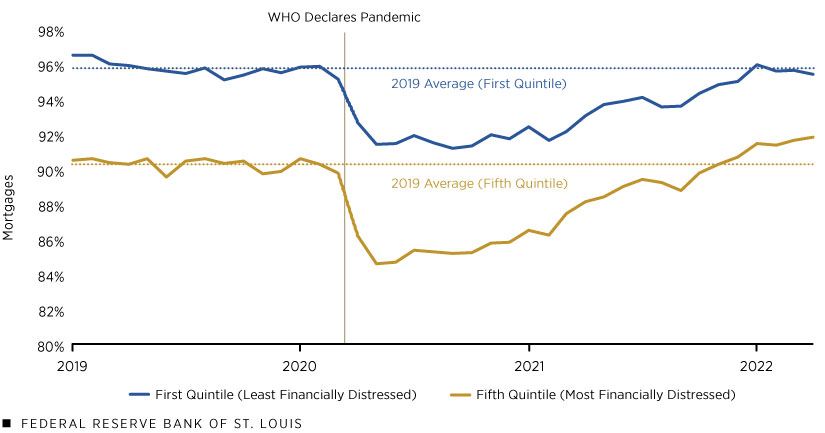
The figure below details how households in low-distress ZIP codes were more likely to be current on their mortgages than households in high-distress ZIPs. The authors also included horizontal dotted lines to show the average percentage of current loans in 2019, the last full year before the pandemic, for each group.
Mortgages Current on Payments over Time by Quintile of Financial Distress

SOURCES: Federal Reserve Bank of New York Consumer Credit Panel/Equifax, Black Knight McDash and authors’ calculations.
NOTE: The vertical gray bar marks March 11, 2020, the date that the World Health Organization declared COVID-19 a pandemic.
When the pandemic hit, the percentage of mortgages that were current steeply declined.
“By May 2020, the percentage of current loans in the least distressed quintile had fallen significantly to 91.53%, a 4.4 percentage point decline relative to its 2019 average of 95.93%,” Sánchez and Wilkinson wrote. “At the same time, the percentage of current loans in the most distressed quintile had dropped to 84.64%, a 5.74 percentage point decline relative to its 2019 average of 90.38%.”
Also, the figure shows how the rate of mortgages that were current recovered for both groups since May 2020. Mortgage repayment in the fifth-quintile ZIP codes recovered faster than in the first-quintile ZIP codes, the authors found.
Citation
ldquoHow Mortgage Repayments Recovered since COVID-19’s Onset,rdquo St. Louis Fed On the Economy, Feb. 6, 2023.
This blog offers commentary, analysis and data from our economists and experts. Views expressed are not necessarily those of the St. Louis Fed or Federal Reserve System.
Email Us
All other blog-related questions

