Recent Trends in Unauthorized Crossing Attempts at the Southwestern U.S. Border
A sharp increase in enforcement encountersAn enforcement encounter by U.S. Customs and Border Protection involves a noncitizen who is apprehended by U.S. Border Patrol or determined to be inadmissible by the Office of Field Operations, except for those whose applications for admission are terminated without prejudice, who are crewmen refused landing rights or detained on board, or who are granted parole status. at the southwestern U.S. border in recent years has received much attention in both the U.S. media and policy circles. While the strong U.S. economic recovery from the COVID-19 recession contributed “pull” factors for migrants seeking jobs, “push” factors such as political instability and insecurity in Central America and South America have also contributed to the rise in attempts to cross illegally into the U.S. While the pull factors attract all potential migrants, the push factors are specific to the “source” nations of the migrants. Keeping the latter in mind, we highlight the pattern of attempted unauthorized border crossings from different source nations.
Mexico as a Source Nation in the 2007-23 Period
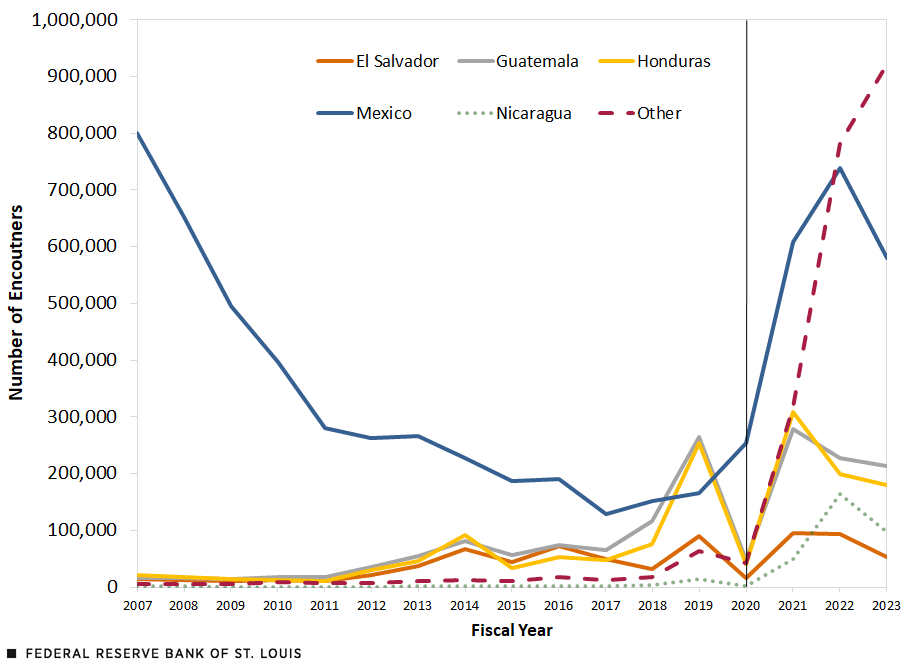
Two facts stand out in the first figure, which reports encounters for the top five source nations (ranked by cumulative encounters) and all “others” from fiscal year 2007 to fiscal year 2023.The federal government’s fiscal year begins on Oct. 1 and ends on Sept. 30 of the next calendar year. For example, fiscal year 2023 began on Oct. 1, 2022, and ended on Sept. 30, 2023. First, encounters with Mexican nationals show a U-shaped pattern between 2007 and 2022, with a modest decline in 2023; these encounters reached their lowest level in 2017. Second, in 2022, nations outside the top five accounted for the largest number of encounters for the first time, and the gap vis-à-vis other nations in the figure increased in 2023, indicating a greater diversification of source nations of those migrants in recent years.Others have also observed this shift. For example, a September 2023 Migration Policy Institute report, authored by Jennifer Van Hook, Julia Gelatt and Ariel G. Ruiz Soto, notes such diversification in recent estimates of the pool of unauthorized immigrants in the U.S. Such diversification was also noted using encounters data in a recent Wall Street Journal article.
Digging deeper, we found that Mexico accounted for an overwhelmingly large percentage (93%) of total encounters in fiscal year 2007, but this share had dipped to a low of 20% in 2019; it was 28% in 2023.
Total Enforcement Encounters at the Southwestern U.S. Border by National Origin

SOURCES: U.S. Customs and Border Protection and authors’ calculations.
NOTE: Encounters reported by the U.S. Border Patrol. Vertical line denotes the year when the U.S. declared a COVID-19 national emergency; the emergency was declared by the president on March 13, 2020.
Comparing the Pre-Pandemic Period with the Pandemic/Post-Pandemic Period
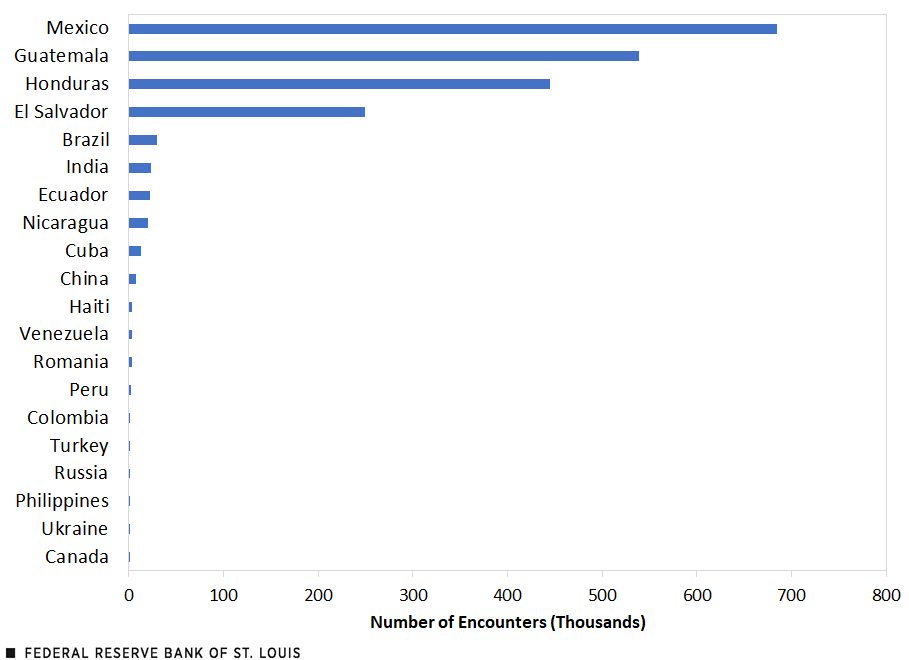
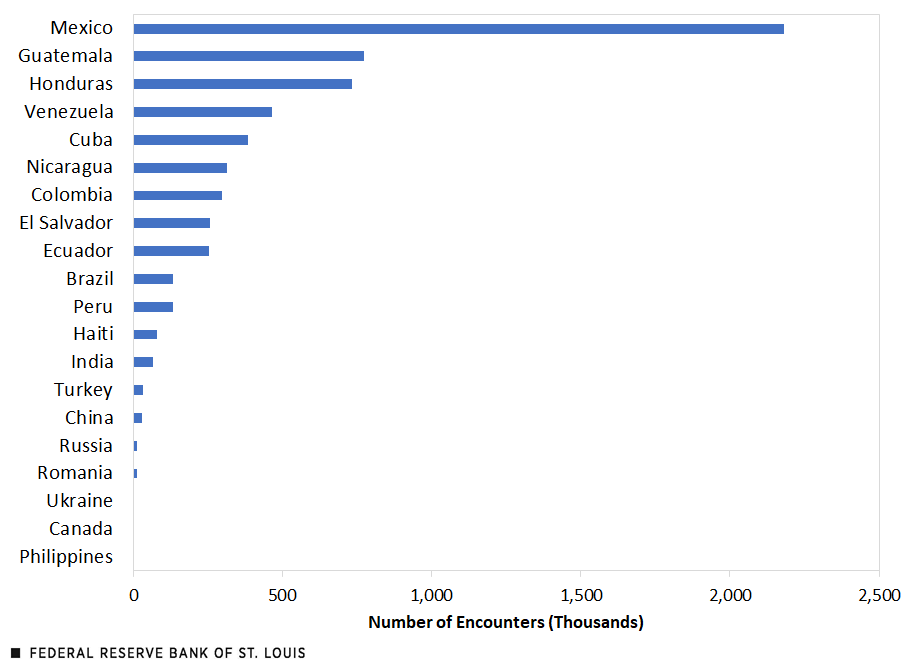
The second and third figures split the available encounters data for the top 20 source nations (in terms of cumulative encounters) into two periods: The second figure considers the pre-pandemic period of October 2015 through December 2019, while the third figure spans the pandemic/post-pandemic period of 46 months, starting January 2020 and ending October 2023.The pre-pandemic period includes 51 months of data rather than 46 months. To get a comparable pre-pandemic period, we need to go back 46 months from December 2019, which takes us to March 2016. However, the lack of source nation-based monthly data in 2016 forced us to stretch the pre-pandemic period to fiscal year 2016 (which started Oct. 1, 2015) for which source nation-based data are available.
First, a comparison of the two figures shows a much larger scale of encounters for most of the top source nations in the pandemic/post-pandemic period. Second, we see a substantial change in the ranking of top source nations between the two periods: Cuba, Venezuela and Colombia emerged as some of the largest source nations in the second period.
Total Enforcement Encounters at the Southwestern U.S. Border by National Origin, Cumulative from October 2015 to December 2019

Total Enforcement Encounters at the Southwestern U.S. Border by National Origin, Cumulative from January 2020 to October 2023

SOURCES FOR BOTH FIGURES: U.S. Customs and Border Protection and authors’ calculations.
A Deeper Dive into Recent Monthly Encounters Data
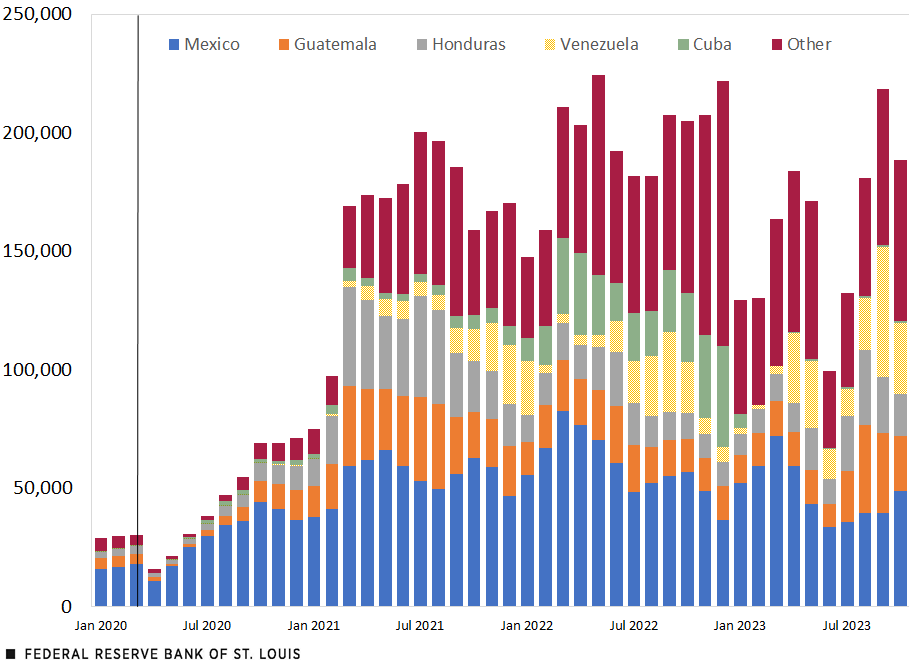
To get a clear picture of month-to-month fluctuations in recent years, the fourth figure presents monthly encounters for the top five source nations (ranked by cumulative encounters since January 2020) and all other source nations. Interestingly, Cuba was an important source nation for most of 2021 and 2022 but has not featured prominently in recent months. Encounters with Mexican nationals also seem to have moderated in recent months, although total encounters with all nationalities have risen on a month-over-month basis during July through September while declining somewhat in October.
Monthly Enforcement Encounters at the Southwestern U.S. Border by National Origin

SOURCES: U.S. Customs and Border Protection and authors’ calculations.
NOTE: Vertical line marks the month when the U.S. declared a COVID-19 national emergency; the emergency was declared by the president on March 13, 2020.
Conclusion
The emergence of COVID-19 in the U.S. and the subsequent recovery have led to some notable changes in the pattern of border encounters compared with the pattern in the pre-pandemic era. What is also clear from our analysis is that while Mexico remains a major source of migrants apprehended while attempting to cross the border, the country’s share has declined substantially compared with its share in fiscal year 2007, a period that ended before the Great Recession began in December 2007. Accordingly, analyzing the effectiveness of curbing unauthorized crossings may need to consider other source nations and the transit nations through which these migrants travel.
Notes
- An enforcement encounter by U.S. Customs and Border Protection involves a noncitizen who is apprehended by U.S. Border Patrol or determined to be inadmissible by the Office of Field Operations, except for those whose applications for admission are terminated without prejudice, who are crewmen refused landing rights or detained on board, or who are granted parole status.
- The federal government’s fiscal year begins on Oct. 1 and ends on Sept. 30 of the next calendar year. For example, fiscal year 2023 began on Oct. 1, 2022, and ended on Sept. 30, 2023.
- Others have also observed this shift. For example, a September 2023 Migration Policy Institute report, authored by Jennifer Van Hook, Julia Gelatt and Ariel G. Ruiz Soto, notes such diversification in recent estimates of the pool of unauthorized immigrants in the U.S. Such diversification was also noted using encounters data in a recent Wall Street Journal article.
- The pre-pandemic period includes 51 months of data rather than 46 months. To get a comparable pre-pandemic period, we need to go back 46 months from December 2019, which takes us to March 2016. However, the lack of source nation-based monthly data in 2016 forced us to stretch the pre-pandemic period to fiscal year 2016 (which started Oct. 1, 2015) for which source nation-based data are available.
Citation
Subhayu Bandyopadhyay and Hoang Le, ldquoRecent Trends in Unauthorized Crossing Attempts at the Southwestern U.S. Border,rdquo St. Louis Fed On the Economy, Dec. 4, 2023.
This blog offers commentary, analysis and data from our economists and experts. Views expressed are not necessarily those of the St. Louis Fed or Federal Reserve System.
Email Us
All other blog-related questions


