


How Do the Rich Become and Stay Wealthy?
Where do the wealthiest get their wealth? In a May Regional Economist article, St. Louis Fed Research Officer Serdar Ozkan looked at how the rich acquired and retained their wealth.
The article was based on a St. Louis Fed working paper by Ozkan and fellow researchers Elin Halvorsen of Statistics Norway and Joachim Hubmer and Sergio Salgado of the University of Pennsylvania. They examined panel data on Norwegians from 1993 to 2015. The data includes information on households’ financial and nonfinancial wealth, labor income, capital income, taxes financial gifts from parents and inheritances.
In the Regional Economist article, Ozkan noted that the researchers were able to look at how the wealth and portfolio composition of the richest 0.1% of households evolved over 22 years—from 1993, when they were in their late 20s, to 2015, when they were in their 50s.
Traits of the Wealthiest 0.1%
Ozkan noted that, on average, the wealthiest individuals began their careers significantly richer than other households in the same cohort. For example, the richest 0.1% of households at ages 50 to 54 owned about 120 times the economywide average wealth, which was $437,000 in 2015. When these same households were in their late 20s, they already possessed, on average, 20 times the economywide average wealth, Ozkan pointed out.
Ozkan also noted that the wealthiest households at ages 50 to 54 were heavily invested in equity, particularly private businesses, starting at a young age. For instance, he pointed out, the wealthiest individuals held 85% to 90% of their wealth in equity, whereas below-median households held 90% of their total assets in housing. Consequently, the wealthiest earned markedly higher returns.
“It follows, then, that equity income, including capital gains, provided the main source—83%—of total lifetime income for the wealthiest 0.1%. In contrast, households in the bottom 90% of the wealth distribution earned 80% to 90% of their lifetime income from labor services,” Ozkan wrote. “Interestingly, inheritances (accrued between 1994 and 2014) constituted a negligible fraction of resources for all wealth groups, including the top wealth owners.”
The richest households were also significant savers. Ozkan noted that the wealthiest 0.1% of households had saved 70% of their gross income over the study period.
He also reported on the working paper’s findings regarding the importance of various factors for wealth accumulation and how much they contributed to the wealth gap between the richest 0.1% of households and the median-wealth households. (See the figure below from his Regional Economist article.)
Ozkan noted that, by around age 50, the following factors accounted for most of the wealth gap: higher savings rates (34.3% of the gap), higher initial wealth (32.3%) and higher returns on wealth (26.7%). The rest of the wealth gap was due to higher labor income (5.3%) and higher inheritances (1.3%).
“From this analysis, we concluded that higher labor income and higher returns on wealth, commonly considered the primary sources of wealth inequality, account for only a third of the wealth gap between the richest and the median-wealth households; we also concluded that initial wealth and savings rates are important,” Ozkan wrote.
Determinants of Wealth for Top 0.1% Accumulators
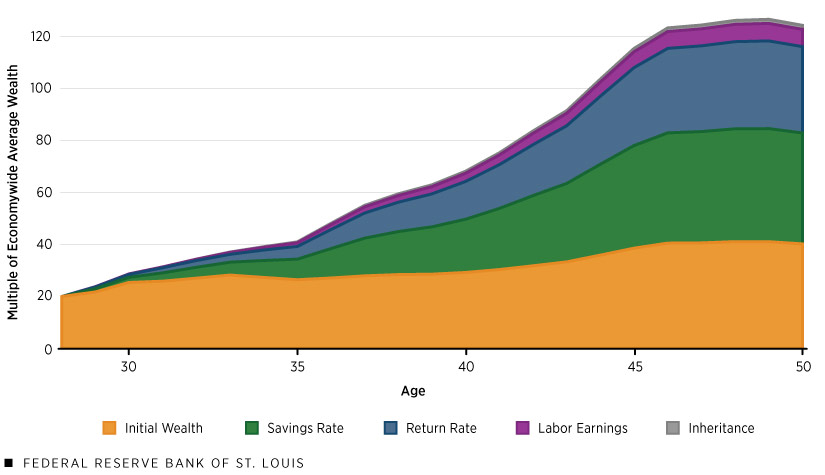
SOURCE: Right panel of Figure 15 from the author’s 2023 Federal Reserve Bank of St. Louis working paper.
NOTES: Data are from 1993 to 2015. The figure decomposes the wealth of the households in the top 0.1% of the wealth distribution, measured in 2015, from the start of the period, when they were in their 20s, to the end of the period, when they were in their 50s. Values are relative to the median-wealth households and are shown in multiples of economywide average wealth, which was $437,000 in 2015.
A Comparison of New Money and Old Money
Ozkan also discussed how wealth accumulation of the “New Money” group (the fraction of the richest 0.1% of households in 2015 who began their careers in the bottom quarter of the initial wealth distribution) differed from that of the “Old Money” group (those in the top 0.1% in 2015 who started their working lives in the top quarter of the initial wealth distribution).
At the start of their careers, the New Money group had negative wealth (that is, they borrowed money) and had little private equity, Ozkan noted. This group then saw their wealth grow rapidly; they earned even higher returns on wealth and saved at higher rates than those in the Old Money group. Also, they increasingly shifted their asset portfolio from housing to private equity.
“After 22 years, even though their portfolio allocation looked like that of the Old Money, their net worth still fell short of reaching Old Money levels,” Ozkan wrote.
Ozkan provided a breakdown of what accounted for the wealth gap between the New Money and the median-wealth households, as shown in the figure below. He noted that, by age 50, the various factors accounted for the following percentages of the gap:
- Higher savings rates (45.8%)
- Higher rates of return on wealth (33.7%)
- Higher labor income (16.1%)
- Higher inheritances (5.8%)
- Initial wealth, which started out negative for the New Money group (-1.4%)
Determinants of New Money Wealth
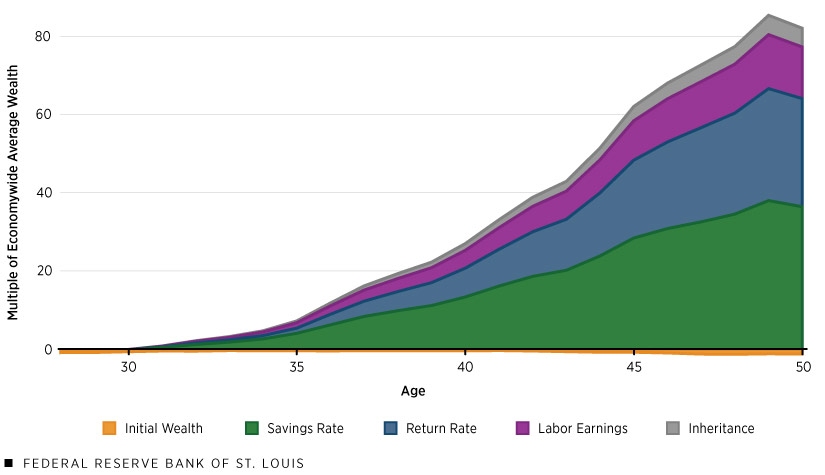
SOURCE: Right panel of Figure 17 from the author’s 2023 Federal Reserve Bank of St. Louis working paper.
NOTES: Data are from 1993 to 2015. The figure decomposes the wealth of New Money households in the top 0.1% of the wealth distribution, measured in 2015, from the start of the period, when they were in their 20s, to the end of the period, when they were in their 50s. Values are relative to the median-wealth households and are shown in multiples of economywide average wealth, which was $437,000 in 2015.
Ozkan also provided a similar breakdown of the wealth gap between the Old Money and the median-wealth households, as shown in the next figure. In this case, by age 50, the various factors accounted for the following percentages of the gap:
- Higher initial wealth (42.7%)
- Higher savings rates (29.5%)
- Higher rates of return on wealth (23.8%)
- Higher labor income (3.1%)
- Higher inheritances (0.8%)
Determinants of Old Money Wealth
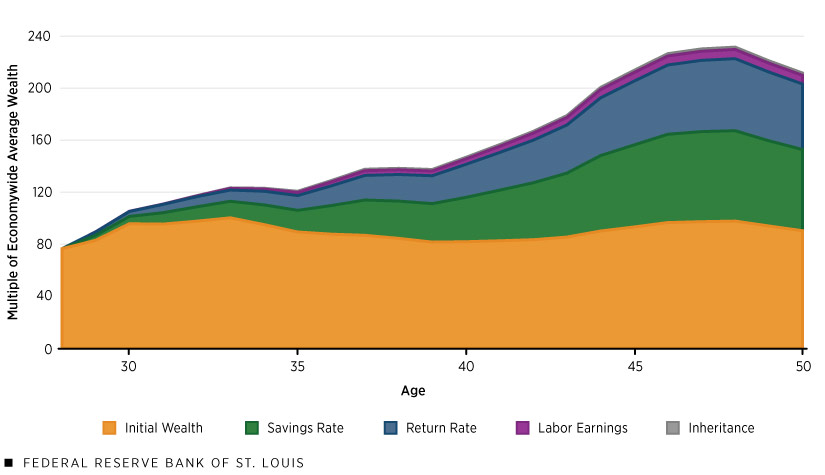
SOURCE: Left panel of Figure 17 from the author’s 2023 Federal Reserve Bank of St. Louis working paper.
NOTES: Data are from 1993 to 2015. The figure decomposes the wealth of Old Money households in the top 0.1% of the wealth distribution, measured in 2015, from the start of the period, when they were in their 20s, to the end of the period, when they were in their 50s. Values are relative to the median-wealth households and are shown in multiples of economywide average wealth, which was $437,000 in 2015.
Ozkan concluded: “These results highlight that the wealthiest households in our sample are a heterogeneous group composed of successful, self-made entrepreneurs who rose from the bottom and middle of the wealth distribution, as well as those who started their working lives with significant wealth invested in high-return private businesses.”
Citation
ldquoHow Do the Rich Become and Stay Wealthy?,rdquo St. Louis Fed On the Economy, Aug. 21, 2023.
This blog offers commentary, analysis and data from our economists and experts. Views expressed are not necessarily those of the St. Louis Fed or Federal Reserve System.
Email Us
All other blog-related questions