


Where Do the Wealthiest Get Their Wealth?
KEY TAKEAWAYS
- An analysis of panel data from Norway suggests that, on average, the wealthiest 0.1% of households are already rich in their 20s, invest heavily in equity and save much of their income.
- “New Money” describes wealth accumulators in the top 0.1% who started off relatively poor. Higher savings rates and higher returns on wealth primarily drive the New Money fortunes.
- “Old Money” describes wealth accumulators in the top 0.1% who started off relatively rich. Greater initial wealth compared with that of median households primarily drives Old Money fortunes.
The concentration of wealth is increasingly at the center of public discourse, prompting an active debate on, for example, whether the government should tax wealth. This question suggests that one should study how the wealthiest accumulate their fortunes—i.e., whether such fortunes are inherited or self-made, or perhaps the result of great thrift—because different mechanisms will imply different policy prescriptions.
In my recent working paper with Elin Halvorsen of Statistics Norway and Joachim Hubmer and Sergio Salgado of the University of Pennsylvania, we studied how some of the richest of the rich accumulated wealth over their working lives.See our 2023 Federal Reserve Bank of St. Louis working paper, “Why Are the Wealthiest So Wealthy? A Longitudinal Empirical Investigation.”
Where Do the Wealthy Get Their Wealth?
The richest of the rich tend to already be wealthy in their 20s, invest heavily in equity and save much of their incomes. St. Louis Fed economist Serdar Ozkan breaks down how the wealthiest 0.1% of households accumulated their fortunes.

Serdar Ozkan: I’m Serdar Ozkan. I’m a research officer at the Federal Reserve Bank of St. Louis.
On average, the richest 0.1% of households tend to have a large amount of wealth at the beginning of their working lives. In other words, the wealthiest often start out that way. They also tend to invest heavily in equity—in particular, private businesses—from a young age, and in turn earn higher returns. Finally, they also save a large share of their income from work and investment.
We arrived at these observations using data from Norway. Our analysis identified the richest 0.1% of households in that country in 2015, when they were 50 to 54 years old. We then traced how their wealth evolved from the beginning of the sample period in 1993, when these households were in their late 20s.
Our research also offers some insights into how the richest 0.1% of households got that way.
For example, we can look at how the 50-year-old top 0.1% of wealth owners accumulated their wealth and compare it to median-wealth households. Specifically, we can break down their fortunes over their working lives and determine how much of the wealth gap between top and median wealth owners is due to differences in initial wealth, inheritances, income from work, investment returns and saving rates.
We found that higher initial wealth in their mid-20s, higher saving rates and higher returns on investment accounted for, in about equal terms, most of the wealth gap by around age 50. We also found that the relative importance of initial wealth in explaining the wealth gap declined as households got older, while higher saving rates and investment returns became more important.
This makes sense. You would expect your income to rise, and thus the amount you can save, over the course of a career, and hopefully investments to grow over time.
Exploring this topic is important because the concentration of wealth is increasingly at the center of public discourse. For instance, whether or not the government should tax wealth is an area of active debate.
At the end of the day, our research finds that initial wealth and saving rates remain important for explaining the top 0.1%’s overall wealth. Higher income from work and larger returns on wealth, often considered the primary sources of wealth inequality, accounted for only a third of the wealth gap between the richest 0.1% and median households.
Having said that, not everyone in the top wealth group started out rich. We call those who had little wealth in their 20s and who succeeded in joining the wealthiest 0.1% by their 50s the New Money, and we investigate them separately.
Our analysis used Norwegian panel data from 1993 to 2015, which include information on households’ financial and nonfinancial wealth, labor income, capital income and taxes, as well as on financial gifts from parents and inheritances.Comparable longitudinal data on wealth and income are not available for the U.S.; therefore, we cannot conduct a similar study into the wealthiest Americans. However, we think that our findings are not specific to Norway. We investigated how wealth, portfolio composition, income sources, rates of return on investments and savings rates evolved over 22 years, conditional on the most recent wealth quantile and age group.This backward-looking approach, of course, suffers from a “survivorship bias.” For example, by focusing on the characteristics of the wealthiest households, we might overlook important information about households not in this group. Hence, in our working paper, we complement this analysis with a forward-looking investigation that documents the same salient features of the data over the subsequent 22 years, conditional on initial wealth quantile and age group. The forward-looking patterns are very similar to those from the retrospective analysis, on which I focus in this article. For example, we examined how the wealth and portfolios of the richest 0.1% of households—as measured at the end of our sample—evolved from 1993, when these households were in their late 20s, to 2015, when they were in their 50s.
Characteristics of the Wealthiest 0.1% of Households
First, we found that, on average, the wealthiest started their working lives substantially richer than other households in the same cohort. For instance, the richest 0.1% of households at ages 50 to 54 owned about 120 times the economywide average wealth, which was $437,000 in 2015. These same households already owned, on average, a staggering 20 times the economywide average wealth in their late 20s. However, a significant fraction of the richest 0.1% of households at the end of the sample period began their careers with little wealth. We dubbed this group the “New Money,” and later this article will compare their wealth accumulation with that of those who started out rich, whom we refer to as the “Old Money.”
Second, the wealthiest households at ages 50 to 54 were heavily invested in equity, in particular private businesses, starting from very young ages—even compared with people of similar age and wealth earlier in the sample period. For instance, the wealthiest people held 85% to 90% of their wealth in equity, whereas below-median households held 90% of their total assets in housing. As a result, the wealthiest earned significantly higher returns, which were also more volatile and positively skewed.
It follows, then, that equity income, including capital gains, provided the main source—83%—of total lifetime income for the wealthiest 0.1%. In contrast, households in the bottom 90% of the wealth distribution earned 80% to 90% of their lifetime income from labor services. Interestingly, inheritances (accrued between 1994 and 2014) constituted a negligible fraction of resources for all wealth groups, including the top wealth owners.
Third, the savings rate increased from around 10% of gross income for households in the bottom half of the wealth distribution to more than 70% of gross income for households in the top 0.1% of the wealth distribution. In other words, the wealthiest households had saved 70% of their gross income over the 22 years ending in 2015.
New Money and Old Money: Who Are They?
Who, exactly, makes up the richest 0.1%? St. Louis Fed economist Serdar Ozkan explains that top wealth owners include both self-made entrepreneurs who rose to riches and those who started their working lives with significant wealth.

Serdar Ozkan: I’m Serdar Ozkan. I’m a research officer at the Federal Reserve Bank of St. Louis.
In a recent analysis, we broke down a sample of the richest 0.1% of households into two groups, New Money and Old Money. We chose to look at the data this way because it offers some valuable insights into the makeup of the wealthiest segment of the population.
But before getting into who exactly the New Money and Old Money are, let me start with a little background.
We used a data set from Norway that allowed us to identify the wealthiest 0.1% of households in that country in 2015, when they were in their 50s, and then look back at how they accumulated their wealth by tracing them to the beginning of our sample period in 1993, when they were in their late 20s.
New Money is the term we used in our research to describe people who started out in their 20s with little wealth and by age 50 or 54 were in the richest 0.1% of households.
In other words, they are the portion of the richest 0.1% who started out in the poorest quartile two decades earlier. We found that this group actually started out the period with negative wealth, meaning they borrowed money. But like Old Money, the New Money tended to invest heavily in equity, particularly private businesses.
We also found that New Money tends to experience rapid wealth gains early in life. In fact, they earn even higher returns and save at higher rates than Old Money.
Finally, New Money increasingly shifted their portfolios from housing to private equity as they get older.
By comparison, Old Money describes the portion of the richest 0.1% households who started out the sample period in 1993 with the most wealth, specifically in the richest quartile.
Higher starting wealth relative to the median household is the primary component of Old Money fortunes. That is opposed to higher saving rates and higher rates of return, which, like I mentioned, primarily drive New Money fortunes.
However, the data showed that Old Money’s net worth still exceeds New Money’s net worth after 22 years, although by then, their portfolio allocations look alike.
We also investigate the group that began in the wealthiest 0.1% of households at the beginning of the sample period, but fell out of that group by the end of it. These households had lower returns on their investments and saved at lower rates than the median households, and in turn squandered their large initial wealth.
The bottom line is that the richest 0.1% of households seem to consist of both successful, self-made entrepreneurs who rose to the top, as well as those who started their lives with significant wealth invested in high-return private businesses.
Why Are the Wealthiest So Wealthy?
Next, we quantified the importance of each factor—i.e., inheritance, labor earnings, returns on wealth, savings and initial wealth—for top wealth accumulators. As a framework, consider the simple household budget constraint: End-of-year net worth equals the sum of wealth at the beginning of the year plus savings from income, which includes labor income, capital income and intergenerational wealth transfers.
In our analysis, we computed counterfactual wealth profiles over a period of more than two decades for the top wealth owners by replacing each factor in their budget constraint (the return on net wealth, savings rate, and so on) with that factor’s average value for the middle 50% of households—i.e., the median-wealth households. For example, to investigate how the wealth profile would look for wealth owners in the top 0.1% of the population if they had instead earned the same rates of return on wealth as the median-wealth households, we constructed the counterfactual average wealth profile by assigning them the after-tax return of this latter group.
To account for the entire wealth gap, we set all factors to their counterfactual values. For example, we first set the rate of return on wealth to its counterfactual value and constructed the wealth profile. Next, we set the savings rate to its counterfactual value and constructed the wealth profile again. We then repeated this process for each factor. The order of replacement matters; therefore, we measured the effect of each contributing factor as the average of its marginal contribution across all possible permutations.
The following figure decomposes the excess wealth accumulation of the richest 0.1% relative to the median-wealth households. As individuals age, the relevance of their initial wealth declines, whereas higher savings rates and rates of return on wealth become more important in explaining wealth. By around age 50, higher savings rates, higher initial wealth and higher returns on wealth accounted for most of the wealth gap—34.3%, 32.3% and 26.7% of it, respectively.Although we did not have data on intergenerational wealth transfers prior to 1994, we interpreted differences in initial wealth mainly as unobserved intergenerational wealth transfers. The small remainder was a result of higher labor income (5.3% of the wealth gap) and higher inheritances (1.3% of the wealth gap) over the sample period.
Determinants of Wealth for Top 0.1% Accumulators
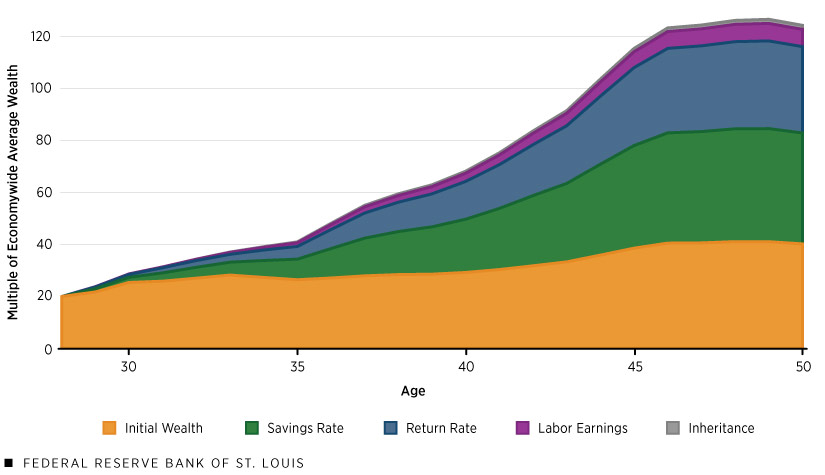
SOURCE: Right panel of Figure 15 from the author’s 2023 Federal Reserve Bank of St. Louis working paper.
NOTES: Data are from 1993 to 2015. The figure decomposes the wealth of the households in the top 0.1% of the wealth distribution, measured in 2015, from the start of the period, when they were in their 20s, to the end of the period, when they were in their 50s. Values are relative to the median-wealth households and are shown in multiples of economywide average wealth, which was $437,000 in 2015.
From this analysis, we concluded that higher labor income and higher returns on wealth, commonly considered the primary sources of wealth inequality, account for only a third of the wealth gap between the richest and the median-wealth households; we also concluded that initial wealth and savings rates are important.
New Money versus Old Money
Although the wealthiest, on average, started much richer than the rest of the population, those who reached the top 0.1% from the bottom quarter of the initial wealth distribution began with negative wealth—of around half the economywide average, meaning they borrowed money—and little private equity. People in this group, the New Money, then experienced rapid growth of their wealth early in their working lives. They earned even higher returns on wealth and saved at higher rates than those in the top quarter of the initial wealth distribution, the Old Money, and they increasingly shifted their portfolio allocation from housing to private equity. After 22 years, even though their portfolio allocation looked like that of the Old Money, their net worth still fell short of reaching Old Money levels.
The next two figures decompose the excess wealth accumulation of the New Money and the Old Money. As the first figure below shows, we found that by age 50, higher savings rates and higher rates of return on wealth primarily accounted for the wealth gap—45.8% and 33.7% of it, respectively—between the New Money and the median-wealth households. Higher labor income also contributed significantly, accounting for 16.1% of the wealth gap. Higher inheritances were a minor factor (making up only 5.8% of the wealth gap), and since the New Money started out relatively poor, their initial wealth actually reduced the wealth gap slightly (by 1.4%).
Determinants of New Money Wealth
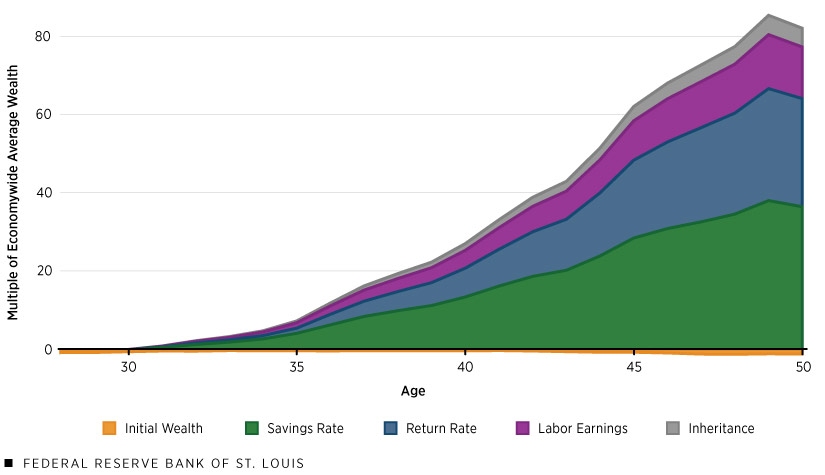
SOURCE: Right panel of Figure 17 from the author’s 2023 Federal Reserve Bank of St. Louis working paper.
NOTES: Data are from 1993 to 2015. The figure decomposes the wealth of New Money households in the top 0.1% of the wealth distribution, measured in 2015, from the start of the period, when they were in their 20s, to the end of the period, when they were in their 50s. Values are relative to the median-wealth households and are shown in multiples of economywide average wealth, which was $437,000 in 2015.
In contrast, as the final figure below illustrates, by age 50, Old Money fortunes were mostly due to higher starting wealth, which accounted for 42.7% of the wealth gap between the Old Money and the median-wealth households. Higher savings rates and higher returns on wealth accounted for most of the remaining wealth gap—29.5% and 23.8% of it, respectively—with higher labor income (3.1% of the wealth gap) and higher inheritances (0.8% of the wealth gap) playing only small roles over the sample period.
Determinants of Old Money Wealth
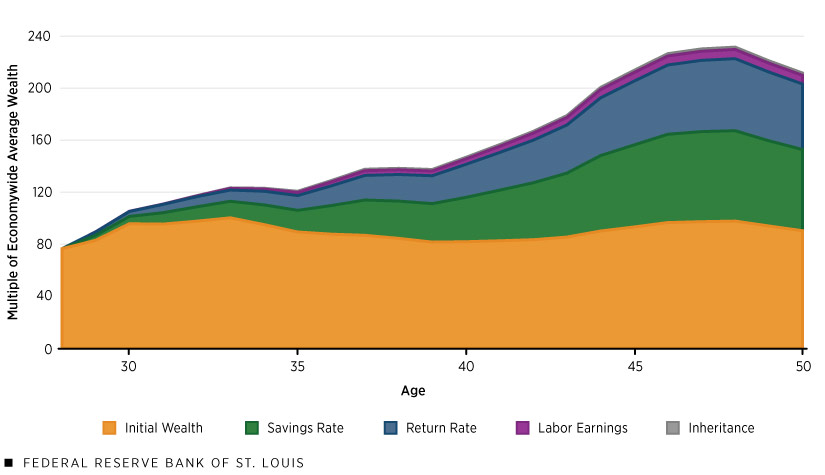
SOURCE: Left panel of Figure 17 from the author’s 2023 Federal Reserve Bank of St. Louis working paper.
NOTES: Data are from 1993 to 2015. The figure decomposes the wealth of Old Money households in the top 0.1% of the wealth distribution, measured in 2015, from the start of the period, when they were in their 20s, to the end of the period, when they were in their 50s. Values are relative to the median-wealth households and are shown in multiples of economywide average wealth, which was $437,000 in 2015.
Conclusion
These results highlight that the wealthiest households in our sample are a heterogeneous group composed of successful, self-made entrepreneurs who rose from the bottom and middle of the wealth distribution, as well as those who started their working lives with significant wealth invested in high-return private businesses.
Notes
- See our 2023 Federal Reserve Bank of St. Louis working paper, “Why Are the Wealthiest So Wealthy? A Longitudinal Empirical Investigation.”
- Comparable longitudinal data on wealth and income are not available for the U.S.; therefore, we cannot conduct a similar study into the wealthiest Americans. However, we think that our findings are not specific to Norway.
- This backward-looking approach, of course, suffers from a “survivorship bias.” For example, by focusing on the characteristics of the wealthiest households, we might overlook important information about households not in this group. Hence, in our working paper, we complement this analysis with a forward-looking investigation that documents the same salient features of the data over the subsequent 22 years, conditional on initial wealth quantile and age group. The forward-looking patterns are very similar to those from the retrospective analysis, on which I focus in this article.
- Although we did not have data on intergenerational wealth transfers prior to 1994, we interpreted differences in initial wealth mainly as unobserved intergenerational wealth transfers.

Views expressed in Regional Economist are not necessarily those of the St. Louis Fed or Federal Reserve System.
For the latest insights from our economists and other St. Louis Fed experts, visit On the Economy and subscribe.
Email Us