


Gauging the Fed’s Current Tightening Actions: A Historical Perspective
At the conclusion of their July 26, 2023, meeting, the Federal Open Market Committee (FOMC) voted to raise the target range of the federal funds rate by 25 basis points to 5.25% to 5.50%. This blog post will examine the magnitude of the FOMC’s current actions relative to those since 1983 and, importantly, whether monetary policy has moved into restrictive territory.
The current tightening episode is the seventh in the past 40 years; a tightening action is defined as a series of increases in the federal funds target rate (FFTR). In the aftermath of the financial crisis and recession from late 2007 to mid-2009, the FOMC has targeted a range that spans 25 basis points. Prior to 2007, the FOMC targeted an interest rate level (e.g., 4.5%). Hereafter, the FFTR will refer to either the rate level prior to 2007 or the midpoint of the target range after 2007.
A Look at Nominal Rate Increases
The figure below plots the nominal FFTR since the 1983-84 tightening episode. The figure tracks the level of the nominal FFTR from just prior to the liftoff date to the terminal (or peak) rate. Currently, the FFTR is well above the peak rate that occurred in the 2015-18 episode (2.375%) but close to the peak rate at the end of the 2004-06 episode (5.25%). The peak nominal FFTR was 6% or higher in the other four episodes. The maximum occurred at the end of the 1983-84 episode, when the FFTR peaked at 11.5%.
Nominal Federal Funds Target Rate Increases during FOMC Tightening Episodes since 1983
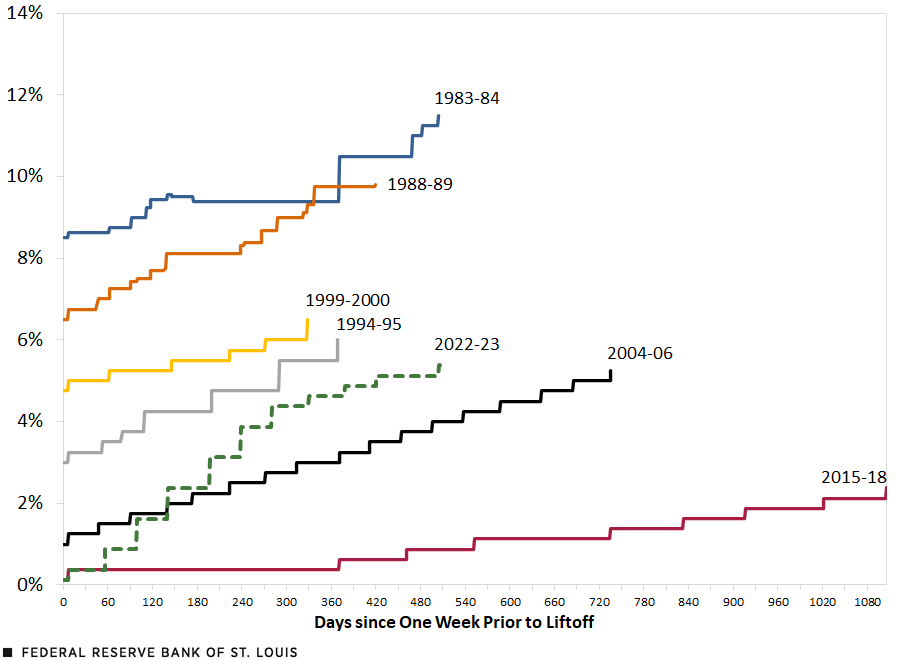
SOURCES: Haver Analytics and author’s calculations.
The next figure plots the magnitude of the FFTR increases since liftoff for each of the seven episodes—that is, the cumulative increase from beginning to end. The current episode is notable because the FFTR range has increased by 525 basis points (5.25 percentage points). The current episode is thus larger than the cumulative increases in the other six episodes. The 2004-06 episode was the closest in magnitude at 425 basis points. The smallest cumulative increase occurred during the 2015-18 episode, when the FOMC raised the midpoint of the target range by 225 basis points.
The Magnitude of Nominal Federal Funds Target Rate Increases during FOMC Tightening Episodes since 1983
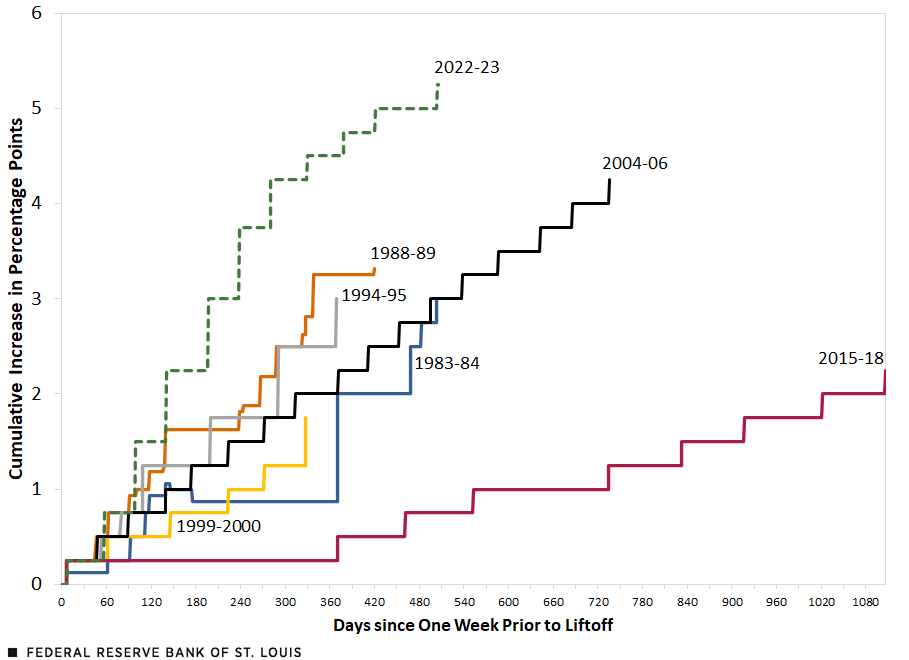
SOURCES: Haver Analytics and author’s calculations.
The Monetary Stance and the Real Interest Rate
Many important interest rates in the economy, such as mortgage rates or rates on new auto loans, are priced in nominal, or current dollar terms. Thus, consumer behavior often responds to changes in nominal rates. Monetary policymakers, however, usually gauge the stance of policy—that is, whether policy is restrictive, neutral, or accommodative—by the real interest rate. That is, the nominal rate less inflation.
The next figure reprises the first figure but instead plots a measure of the real FFTR during the seven tightening episodes. In this case, real FFTR is the nominal rate less the 12-month percent change in the headline (all items) personal consumption expenditures price index (PCEPI). Since the figure plots daily data, the inflation rate during each trading day of the month is assumed to be equal to that month’s measured rate. For example, the June 2023 PCEPI inflation rate was 3%; it is assumed that the daily inflation rate for each of the trading days was fixed at 3%.
Real Federal Funds Target Rate Increases during FOMC Tightening Episodes since 1983
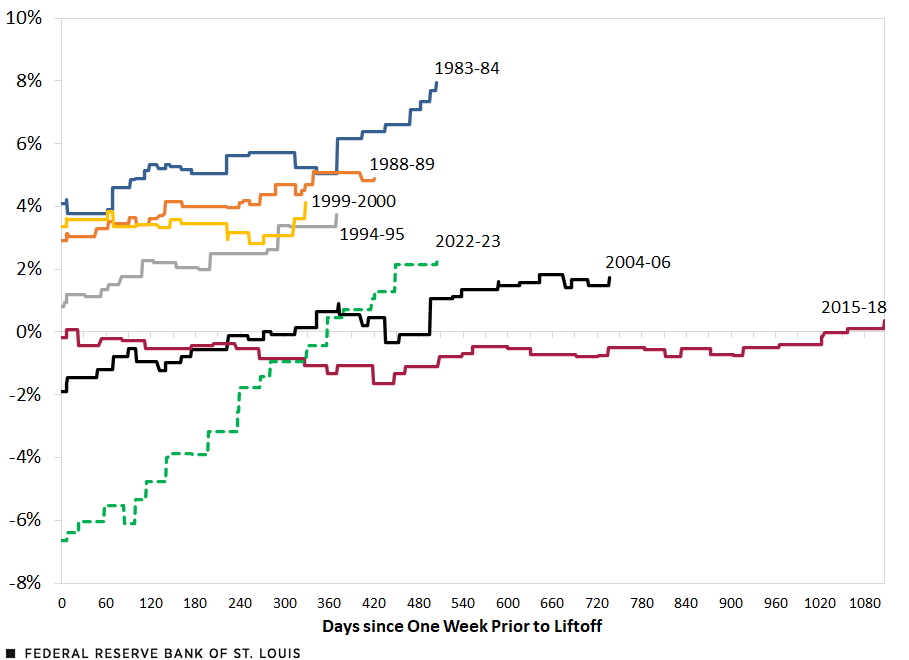
SOURCES: Haver Analytics and author’s calculations.
The real FFTR was estimated at 2.4% at the end of July 2023.The calculation assumes that the July 2023 headline inflation rate is equal to the June 2023 inflation rate. As with the nominal rate, the real FFTR rate in the current episode exceeds the 2004-06 and 2015-18 terminal rates, which were 1.7% and 0.4%, respectively. However, today’s real FFTR still remains, on average, well below the terminal rate in the previous four episodes.
The highest real FFTR rate occurred at the end of the 1983-84 episode (about 8%). During that tightening period, the FOMC was continuing to raise the nominal rate from 8.5% in March 1983 to 11.5% in early August 1984. At the same time, though, headline PCEPI inflation was slowing from 4.4% to 3.6%. Importantly, the sharp increase in the real rate did not result in a recession. In fact, real GDP growth accelerated from 1.4% in the first quarter of 1983 to 6.9% in the third quarter of 1984.
The fourth figure shows the magnitude of the increase in the real FFTR during the seven tightening episodes. The current episode stands out as having the largest cumulative increase in the real policy rate, a little more than 900 basis points. But that is only because, as shown in the third figure, the real rate was deeply negative (-6.6%) at the start of the tightening episode. Other than the aforementioned 1983-84 episode, the next largest cumulative tightening occurred during the 2004-2006 episode.
The Magnitude of Real Federal Funds Target Rate Increases during FOMC Tightening Episodes since 1983
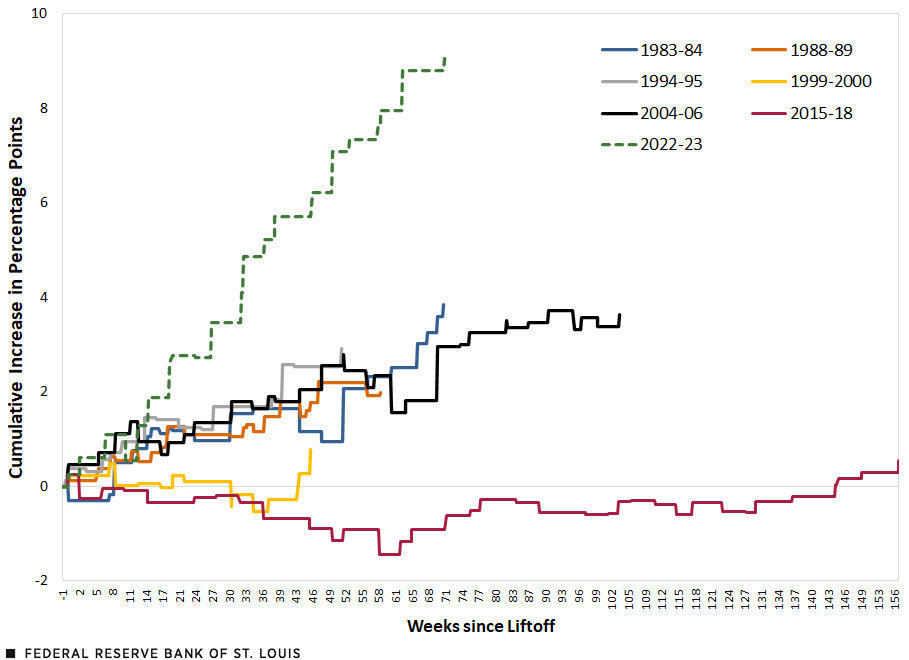
SOURCES: Haver Analytics and author’s calculations.
Positive Real Rates and Restrictive Monetary Policy
The third figure shows that the FOMC increased the real FFTR during each of the seven tightening episodes; in the most recent three episodes, the real FFTR went from negative to positive. At the conclusion of the tightening cycle, the real FFTR ranged from 0.4% in the 2015-2018 episode to 7.9% during the 1983-84 episode. But a positive real rate does not automatically entail a restrictive monetary policy. To assess whether monetary policy has turned restrictive generally requires a rules-based framework, such as the one suggested by former St. Louis Fed President James Bullard.
In four of the previous six Fed tightening episodes, the economy eventually fell into a recession. The two exceptions were 1983-84 and 1994-95. Despite the FOMC’s most recent tightening actions since March 2022, the real economy has continued to expand, and at a pace that exceeds its potential growth rate. Moreover, job growth remains strong, and the unemployment rate remains low. The data thus far suggest that the U.S. economy might avoid a recession this time, as in the 1994-95 episode.
Note
- The calculation assumes that the July 2023 headline inflation rate is equal to the June 2023 inflation rate.

Citation
Kevin L. Kliesen, ldquoGauging the Fed’s Current Tightening Actions: A Historical Perspective,rdquo St. Louis Fed On the Economy, Aug. 15, 2023.
This blog offers commentary, analysis and data from our economists and experts. Views expressed are not necessarily those of the St. Louis Fed or Federal Reserve System.
Email Us
All other blog-related questions