


Examining the Beveridge Curve with a Dual Vacancy Model
Given the Federal Reserve’s most recent decision to increase its policy rate to slow inflation, one question that arises is whether the Fed will be able to slow the economy without causing a recession and a higher unemployment rate. That idea is called “soft landing.”
Some economists argue that a soft landing is possible, especially when job vacancy rates are historically high. Given the near-record vacancy rate and the historically low unemployment rate, a decline in vacancies need not lead to a large increase in unemployment. On the other hand, other economists argue that given the historical Beveridge curve (which represents the relationship between vacancies and unemployment), a decline in vacancies would lead to a large increase in unemployment, making a soft landing hard to achieve.
In this two-part blog series, we present a new perspective in this debate by using findings from a recent working paper by Anton Cheremukhin and Paulina Restrepo-Echavarría. The two economists built a dual vacancy model in which there are two separate matching functions, one for unemployed workers and one for employed workers.For details of this model, see Cheremukhin and Restrepo-Echavarría’s 2022 working paper “The Dual Beveridge Curve,” which was updated in February 2023. It is important to separate these two types of workers because firms engage in both hiring unemployed workers and poaching workers from other firms; this behavior affects the labor market differently.
In this post, we outline the model constructed by Cheremukhin and Restrepo-Echavarría and show its relevance when examining the traditional Beveridge curve. In the second post, we will construct Beveridge curves that take into account this dual vacancy model.
Constructing the Dual Vacancy Model
When a firm hires an individual from the unemployed pool, unemployment decreases, employment increases and there is one less vacancy. On the other hand, hiring an individual from the employed pool will not have any effect on unemployment or employment as it represents just a job-to-job transition, but this will fill one vacancy that was previously open. Taking the same line of reasoning, we raise the point that it is important to have two separate Beveridge curves:
- A curve for the employed pool, which represents the relationship between employed workers who are searching for a job and the vacancies filled from the employed pool
- A curve for the unemployed pool, which reflects the relationship between unemployment and the vacancies filled from the unemployed pool
In their 2022 working paper, Cheremukhin and Restrepo-Echavarría showed how, using data, one can estimate the breakdown of total vacancies between unemployment vacancies and poaching (switching to a new employer) vacancies. They used the Job Openings and Labor Turnover Survey (JOLTS) data to approximate the number of matches from the employed pool, the number of matches from the unemployed pool, and the number of total vacancies. The unemployment rate comes from the Bureau of Labor Statistics and the E subscript s rate—the rate of employed workers searching for a job—is calculated by the number of hires from employment divided by the employer-to-employer transition rate. With these data, they then used Bayesian estimation to estimate the matching efficiencies, the elasticities and vacancies for unemployed workers and employed workers.
The figure below shows total vacancies as well as the split between unemployment vacancies (openings that would likely be filled by jobless workers) and poaching vacancies (those that would likely be filled by job-switching workers) from the beginning of 2001 to the end of 2022.
Evolution of the Vacancy Rate
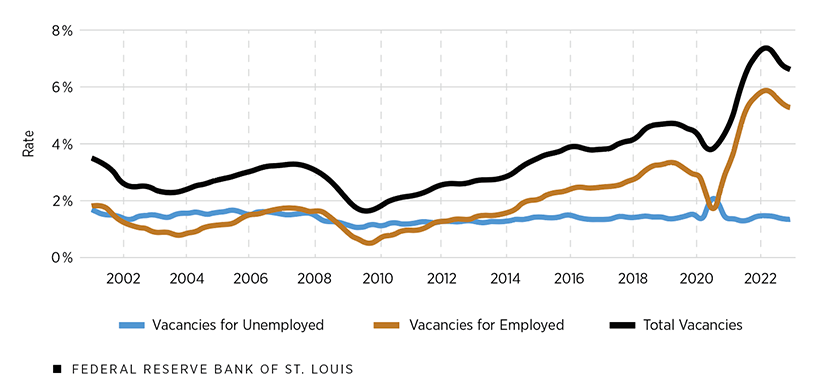
SOURCE: Cheremukhin and Restrepo-Echavarría, 2022.
Prior to 2015, the business cycle behavior of the two types of vacancies was similar as they both declined during the recessions and recovered during the expansions. However, the trend became different during the COVID-19 recession when the vacancies for the unemployed increased while the opposite happened for the employed.
When one looks at the breakdown, it is also clear that since approximately 2015, the fraction of poaching vacancies has increased significantly. By the end of 2022, around 80% of total vacancies are poaching vacancies. The shift in vacancy trends and breakdowns emphasizes the need for separate Beveridge curves: one for the employed and one for the unemployed.
The next figure shows what the Beveridge curve looks like when constructed in a traditional way. The pre-pandemic Beveridge curve, shown in blue, is very different from the pandemic curve (January 2020 to December 2022).
Traditional Beveridge Curve
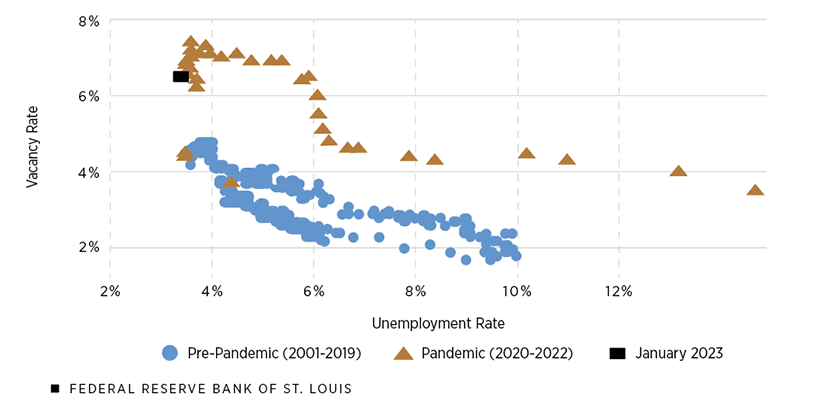
SOURCES: Haver Analytics, Bureau of Labor Statistics and authors’ calculations.
The pandemic Beveridge curve is flatter and vertical in a segment; this could be partially explained by the unique nature of the pandemic. The social distancing measures during the first few months of the pandemic led the unemployment rate to increase significantly. At the same time, because of the restrictions, many employers were not looking to hire more people, which caused the vacancy rate to remain relatively constant. This, in turn, contributed to the unusually flat part of the pandemic Beveridge curve.
As the spike in unemployment rate softened, stimulative fiscal and monetary policies increased purchasing power and demand for goods. The increased consumer demand incentivized firms to expand and hire more workers. This led to a steep rise in job openings (thus, the vacancy rate).
However, this strong demand for workers was, potentially, not met by hires from the unemployed pool, leading to no movements in the unemployment rate. Because of this, the pandemic Beveridge curve has a section that is significantly more vertical than the pre-pandemic one. However, would this trend still hold true if we were to look at the employed and unemployed groups separately? That will be the focus of our next blog post.
Note
- For details of this model, see Cheremukhin and Restrepo-Echavarría’s 2022 working paper “The Dual Beveridge Curve,” which was updated in February 2023.


Citation
Paulina Restrepo-Echavarría and Praew Grittayaphong, ldquoExamining the Beveridge Curve with a Dual Vacancy Model,rdquo St. Louis Fed On the Economy, Aug. 31, 2023.
This blog offers commentary, analysis and data from our economists and experts. Views expressed are not necessarily those of the St. Louis Fed or Federal Reserve System.
Email Us
All other blog-related questions