


Does Labor Market Tightness Vary across States?
On a national level, the labor market appears tight. But how is “tightness” measured, and how much do states vary in their level of tightness?
To answer these questions, Associate Economist Nathan Jefferson and Research Associate Jack Fuller took a state-level look at U.S. labor market supply and demand in an April Regional Economist article.
How to Measure Labor Market Tightness
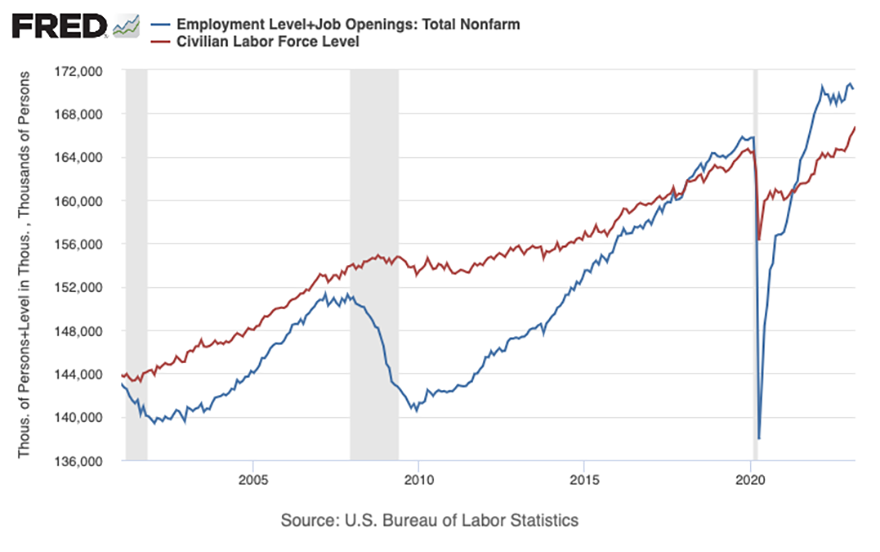
The authors used data from the Bureau of Labor Statistics (BLS) to measure the pressure for new workers. For labor supply, they used the total civilian labor force from the BLS’s Current Population Survey (CPS). To estimate labor demand, they used the total number of employed workers from the CPS plus job openings from the BLS’s Job Openings and Labor Turnover Survey (JOLTS).
The authors used the figure below to gauge changes in labor supply and demand since 2001. They noted that labor demand has been exceeding labor supply by the widest margins since the BLS began collecting JOLTS data in 2000.
Labor Market Tightness Varies across States
“The tight labor market is a nationwide story—as of December 2022, labor demand exceeded supply in every state—but not all states have been affected to the same degree,” the authors wrote. “Nationwide, labor demand outpaced supply by 2.9% in December 2022; that is, there were about 103 job openings plus employed workers for every 100 workers in the labor force.”
However, 30 states plus Washington, D.C., had a tightness ratio greater than the national level, the authors noted.
The figure below uses the authors’ calculations and BLS data to show the excess labor demand ratio for the U.S. states.
Excess Labor Demand across U.S. States, December 2022
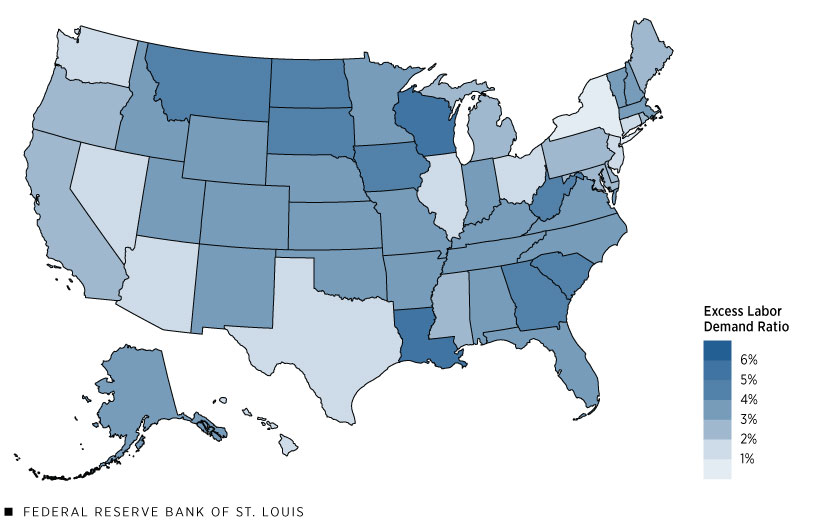
SOURCE: BLS and authors’ calculations.
“Examining the states at either end of the tightness spectrum might shed light on what’s driving regional variation,” the authors wrote.
Washington, D.C., had the highest excess labor demand ratio at 6.8%, according to the authors. Following the nation’s capital were Wisconsin (5.3%), Louisiana (5.2%) and North Dakota (4.7%).
The authors found these three states have similar stories: a spike in job openings combined with a decrease in the labor force.
The authors attributed the labor shortage to many reasons, including an aging workforce and a shortage of young workers interested in jobs in Wisconsin’s manufacturing industry; the return of demand for Louisiana’s tourism and hospitality sector; and low rates of internal migration. (For more specifics on these labor shortages, see the Regional Economist article.)
On the other side of the spectrum, Connecticut (1.4%), New Jersey (1.1%) and New York (0.4%) had the smallest excess labor demand ratios, largely due to a drop in job openings.
The authors summarized their findings as follows: “Differences across states show that variations in labor market tightness primarily come from job openings. States with the tightest labor markets have seen job openings soar and labor forces shrink, while those with the largest mismatches in the opposite direction have seen sharp declines in job openings (as opposed to larger labor forces),” they wrote.
Citation
ldquoDoes Labor Market Tightness Vary across States?,rdquo St. Louis Fed On the Economy, Aug. 10, 2023.
This blog offers commentary, analysis and data from our economists and experts. Views expressed are not necessarily those of the St. Louis Fed or Federal Reserve System.
Email Us
All other blog-related questions