A State-Level Look at U.S. Labor Market Supply and Demand
KEY TAKEAWAYS
- The tight U.S. labor market is a national phenomenon. In December 2022, a measure of labor demand exceeded a measure of labor supply for the U.S. as a whole and in every state.
- Variations in labor market tightness across states are primarily due to job openings, which have risen in states with the tightest labor markets and fallen in those with the loosest.
- Nationwide, labor demand outpaced labor supply by 2.9% at the end of 2022. The Eighth District’s labor market was slightly tighter, with demand outstripping supply by 3.3%.
The tight U.S. labor market has been one of the most significant economic stories coming out of the COVID-19 pandemic. Headline unemployment was 3.4% in January 2023, the lowest rate since April 1969. With output back above pre-pandemic levels, demand for labor is high, and the weight of available evidence suggests that employers are struggling to find workers.
Combining certain Bureau of Labor Statistics (BLS) measures allows us to assess total labor supply and demand and examine how labor market tightness varies nationwide. Differences across states show that variations in labor market tightness primarily come from job openings. States with the tightest labor markets have seen job openings soar and labor forces shrink, while those with the largest mismatches in the opposite direction have seen sharp declines in job openings (as opposed to larger labor forces).
National Labor Shortage
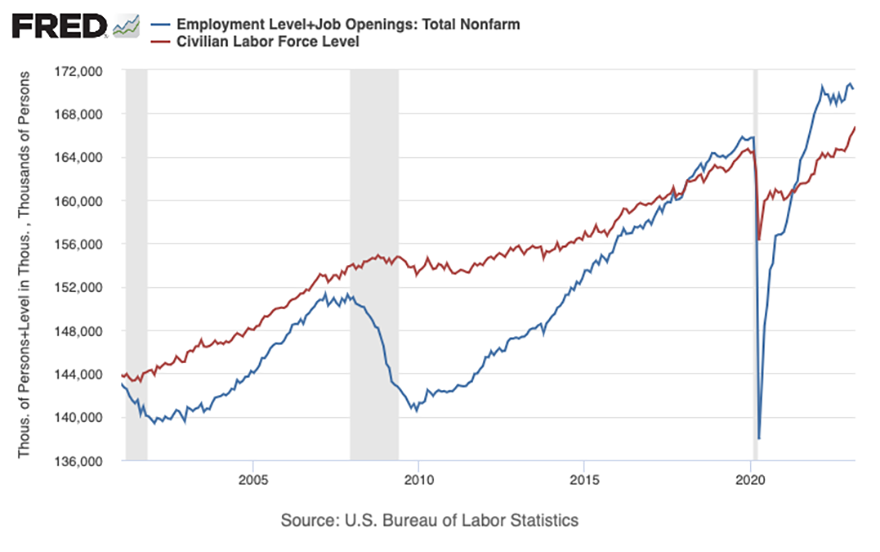
One simple way to measure the pressure for new workers is to compare the total civilian labor force with the total number of employed workers plus job openings.
The civilian labor force, as measured by the Current Population Survey (CPS), can be thought of as the total labor supply. Based on this household survey, the BLS categorizes everyone over 16 as “employed,” “unemployed” or “not in the labor force”; the labor force is the sum of the first two categories.
To approximate the quantity of workers demanded, we can add the total number of employed workers from the CPS to the number of job openings from the Job Openings and Labor Turnover Survey (JOLTS), also conducted by the BLS. Collected since 2000, JOLTS is a smaller survey that estimates the number of job openings, hires and separations across the U.S. economy. Combining the two measures gives us an approximation of how demand for workers has shifted over time. The figure below plots this gauge of labor demand against labor supply since 2001.

Two features of the chart stand out. First, labor demand has been exceeding labor supply, and doing so by the widest margins since the inception of JOLTS. As of December 2022, there were over 5.5 million more job openings than unemployed workers, down slightly from the high of 6.1 million in March 2022. Second, the quantity of labor demand initially surpassed the quantity of labor supply prior to the COVID-19 pandemic. January 2018 was the first month in the history of JOLTS in which the number of job openings was larger than the number of unemployed workers, and this remained the case from March 2018 until the pandemic’s onset in spring 2020.
A large body of work has examined why the civilian labor force has been slow to recover in the wake of the pandemic. For example, St. Louis Fed economist Miguel Faria-e-Castro estimated that there were “slightly over 2.4 million excess retirements due to COVID-19,” and Victoria Gregory, another St. Louis Fed economist, has noted that shifts in people caring for family or the home further contributed to movement out of the labor force during the pandemic across all demographic sectors.For more information, see Miguel Faria-e-Castro’s October 2021 Economic Synopses essay, “The COVID Retirement Boom,” and Victoria Gregory’s February 2022 Regional Economist article, “Why Are Workers Staying Out of the U.S. Labor Force?” Yet even as labor supply has lagged, spending recovered quickly.
Regional Variation in U.S. Labor Market Tightness
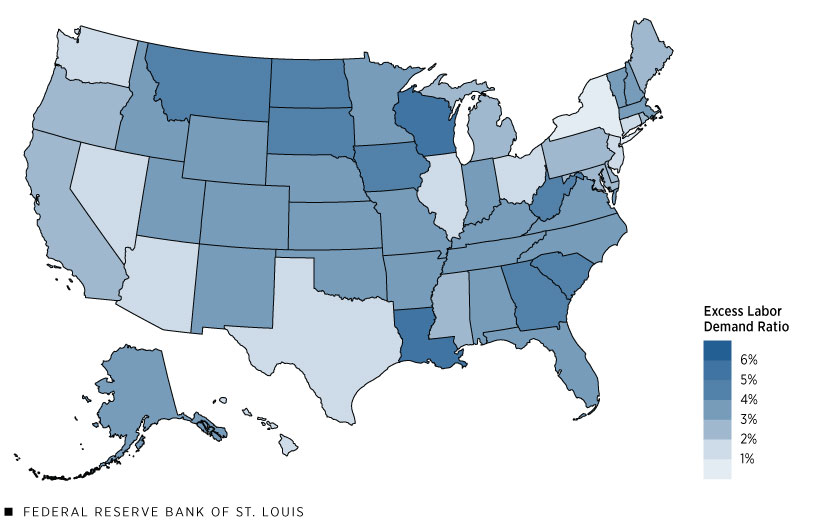
The tight labor market is a nationwide story—as of December 2022, labor demand exceeded supply in every state—but not all states have been affected to the same degree. JOLTS offers state-by-state estimates, which allows us to examine regional variations in labor market tightness. Nationwide, labor demand outpaced supply by 2.9% in December 2022; that is, there were about 103 job openings plus employed workers for every 100 workers in the labor force. However, as the following figure illustrates, 30 out of 50 states (plus Washington, D.C.) had tightness ratios above that level.
Excess Labor Demand across U.S. States, December 2022

SOURCE: BLS and authors’ calculations.
The above figure maps out the ratio of labor demand to labor supply for each U.S. state. Darker colors indicate greater excess demand for labor. Washington, D.C., (not pictured) had the biggest mismatch, with total labor demand 6.8% higher than labor supply. Among the states, Wisconsin (5.3%), Louisiana (5.2%) and North Dakota (4.7%) had the largest tightness ratios, while Connecticut (1.4%), New Jersey (1.1%) and New York (0.4%) had the smallest.
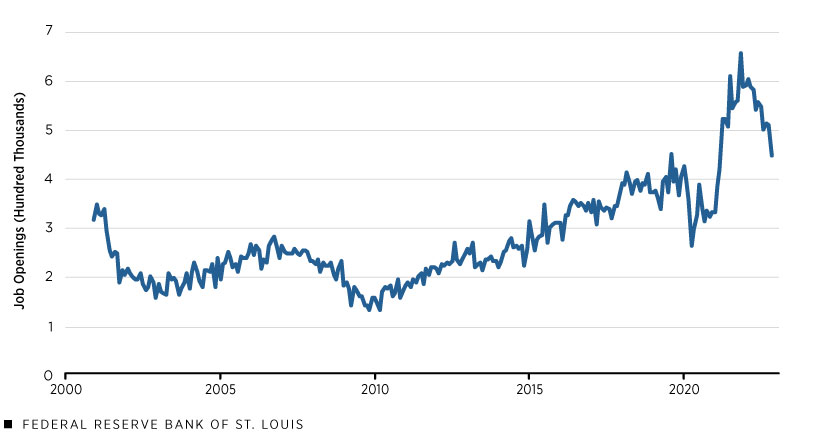
Examining the states at either end of the tightness spectrum might shed light on what’s driving regional variation. In Wisconsin, both a spike in job openings (see the figure below) and a decrease in the labor force have driven a tight market. Since March 2020, the number of job openings has more than doubled (a 110% increase), while the labor force remains below pre-pandemic levels; in fact, Wisconsin’s labor force decreased by 2.3% from March to December 2022. Louisiana and North Dakota have similar stories—job openings at more than double pre-pandemic levels paired with labor forces that are smaller than they were before the pandemic, and which continued decreasing over the second half of 2022.
Number of Job Openings in Wisconsin, 2001-2022

SOURCE: BLS and authors’ calculations.
Key industries in these states are facing labor shortfalls for a variety of demographic and economic reasons. Wisconsin’s per capita manufacturing employment is the highest in the country, but an aging workforce and a shortage of young workers interested in these positions have led to a lack of available labor even as job openings surge. Louisiana’s tourism and hospitality sector has seen demand return after experiencing declines during the pandemic, increasing the need for workers. Other factors behind the labor shortages in these high-tightness states include low rates of internal migration, aging populations and a reduction in the relative advantages of previously high-paying industries, thanks to the tighter labor market nationally.
In contrast, the low-labor-tightness states are largely a story of sharp declines in job openings. New York, New Jersey and Connecticut all have labor forces smaller than they were pre-pandemic, with New York’s almost 4% lower than it was in February 2020—a difference of about 388,000 workers. Yet New York’s labor tightness ratio is close to 1 because job openings fell from a high of 656,000 in November 2021 to 447,000 in December 2022. (See the figure below.) This reflects a return to pre-pandemic levels (New York job openings reached 452,000 in August 2019). While the level of decline was not as large in New Jersey and Connecticut, both likewise saw job openings fall in 2022.
Number of Job Openings in New York, 2001-2022

SOURCE: BLS and authors’ calculations.
Labor Market Tightness in the Eighth District
The labor market across Eighth Federal Reserve District states (except Illinois, which was excluded for purposes of this analysis)Illinois was excluded from our analysis because statistics slant strongly toward Chicago, which is outside the Eighth District. The Eighth District includes all of Arkansas, eastern Missouri, southern Illinois, southern Indiana, western Kentucky, western Tennessee and northern Mississippi. is slightly tighter than it is nationally. The aforementioned measure of excess labor demand for Eighth District states outstripped supply by 3.3% in December 2022, slightly above the 2.9% national average. Tennessee, where demand outpaced supply by 4%, had the tightest labor market in the Eighth District, closely followed by Missouri and Kentucky, in that order. Mississippi, at 2.9%, was the only state in which labor market tightness did not surpass the national average.
There are many explanations for what drives labor force participation and job openings. Aside from the early retirements and child care responsibilities examined in the research mentioned earlier, internal migration, immigration, demographics and the varying industrial makeup of local economies can all play a role in influencing labor demand and supply across states. Yet aggregate estimators can still provide useful information about labor supply and demand, and they will continue to prove valuable for anyone trying to understand how the economy is evolving as it moves past the COVID-19 pandemic.
Notes
- For more information, see Miguel Faria-e-Castro’s October 2021 Economic Synopses essay, “The COVID Retirement Boom,” and Victoria Gregory’s February 2022 Regional Economist article, “Why Are Workers Staying Out of the U.S. Labor Force?”
- Illinois was excluded from our analysis because statistics slant strongly toward Chicago, which is outside the Eighth District. The Eighth District includes all of Arkansas, eastern Missouri, southern Illinois, southern Indiana, western Kentucky, western Tennessee and northern Mississippi.
Views expressed in Regional Economist are not necessarily those of the St. Louis Fed or Federal Reserve System.
For the latest insights from our economists and other St. Louis Fed experts, visit On the Economy and subscribe.
Email Us


