


How U.S. Import Shipping Costs Vary across Countries and Industries
The higher demand for tradable goods observed across countries in the aftermath of COVID-19 increased international shipping costs to unprecedented levels, leading to nontrivial effects on the level of international trade and economic activity.See George A. Alessandria, Shafaat Y. Khan, Armen Khederlarian, Carter B. Mix and Kim J. Ruhl’s 2023 working paper “The Aggregate Effects of Global and Local Supply Chain Disruptions: 2020-2022,” and Jason Dunn and Fernando Leibovici’s 2023 working paper “Navigating the Waves of Global Shipping: Drivers and Aggregate Implications.” In this blog post, we study the extent to which shipping costs act as barriers to U.S. imports across countries and industries during normal times.
To measure shipping costs for U.S. imports, we exploited U.S. Customs data from the U.S. Census Bureau.See USA Trade Online. We computed ad valorem shipping costs across countries and industries as the share of the total cost of imports accounted for by shipping costs. We obtained this measure by computing the ratio between the CIF value of imports (the value of imports including freight and insurance) and the FOB value of imports (“free on board,” the value of imports excluding freight and insurance), and subtracting 1 from this ratio.For an overview of the recent literature on shipping costs, see Adina Ardelean, Volodymyr Lugovskyy, Alexandre Skiba and David Terner’s 2022 working paper “Fathoming Shipping Costs: An Exploration of Recent Literature, Data, and Patterns.” We computed this measure for total U.S. imports across all modes of transportation, and we reported averages for the period 2014-19.
The first figure plots the time series of our ad valorem measure of shipping costs for U.S. imports (the ad valorem shipping cost), and contrasts it with an alternative measure of shipping costs: the simple average import shipping cost for a 20-foot container across all U.S. seaborne routes, as reported by Drewry Shipping Consultants.
Shipping Cost Measures
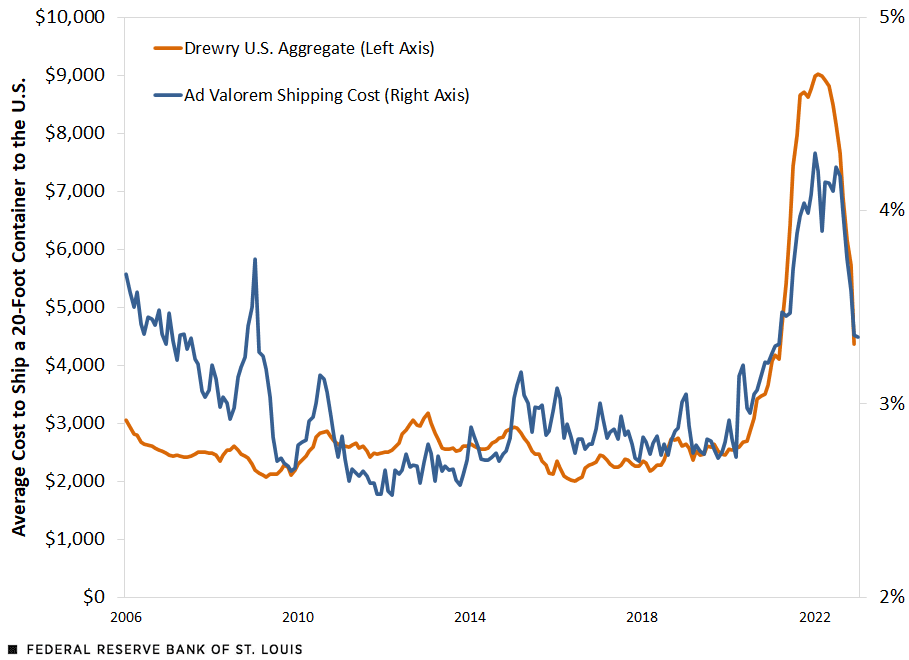
SOURCES: U.S. Census Bureau, Drewry Shipping Consultants and authors’ calculations.
NOTE: The ad valorem shipping cost is calculated by taking the ratio between the cost, insurance and freight (CIF) import value and “free on board” import value, and subtracting 1.
These series are highly positively correlated (their correlation value is 0.78), which shows that our measure of shipping costs is consistent with other standard measures. The advantage of our measure, however, is that it allows us to compute these shipping costs in relation to import values and to disaggregate them across import sources and industries.
Shipping Costs across Importing Countries
We then proceeded to disaggregate shipping costs by countries. The second figure reports the shipping rates for the top 28 U.S. import sources.These are all the countries that made up a share of at least 0.5% of total U.S. imports between 2014 and 2019.
Ad Valorem Shipping Costs, by Country
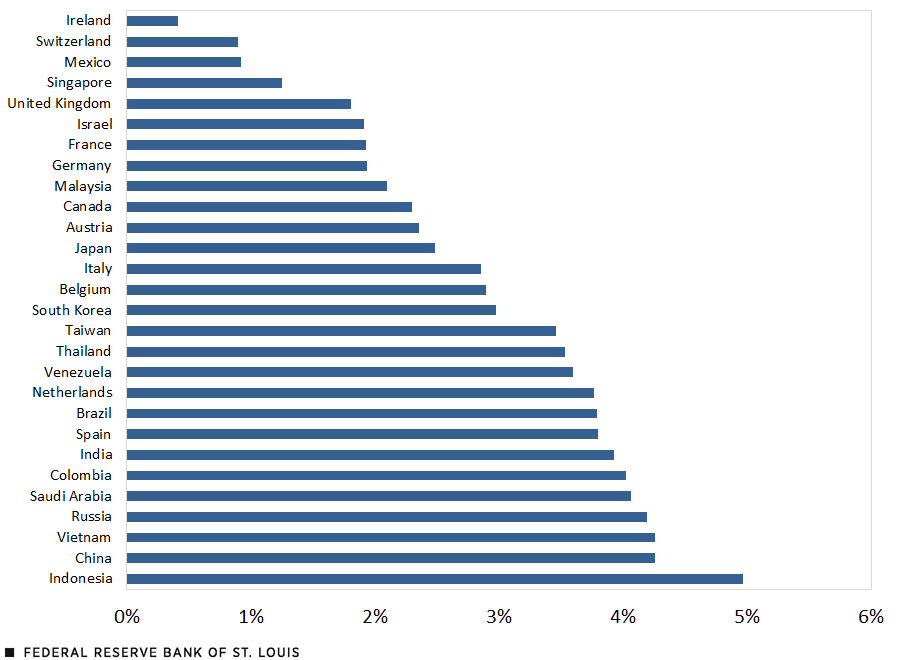
SOURCES: U.S. Census Bureau and authors’ calculations.
NOTE: The ad valorem shipping cost is calculated by taking the ratio between the cost, insurance and freight (CIF) import value and “free on board” import value, and subtracting 1.
We find that shipping costs are largely increasing in the distance between the U.S. and the import source: Imports from countries that are farther away from the U.S. (like China, Russia or India) tend to have larger ad valorem shipping costs, while countries that are closer (e.g., Mexico, Canada and the U.K.) tend to exhibit shipping costs that are relatively lower. The differences are significant: Shipping costs account for more than 4% of the total value of imports from Russia, China and Vietnam, while they account for less than 2% of the total value of imports from the U.K., Mexico and Switzerland.
Shipping Costs across Industries
Shipping costs are also significantly heterogeneous across industries. The third figure reports the shipping rates for the set of 27 tradable three-digit North American Industry Classification System (NAICS) industries, as classified by the U.S. Census Bureau.
Ad Valorem Shipping Costs, by Industry
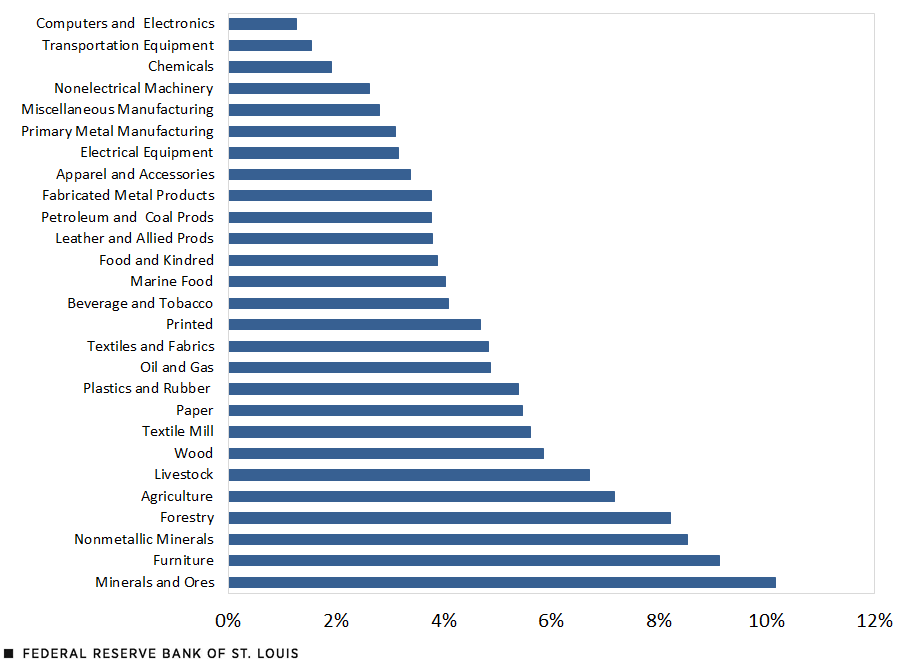
SOURCES: U.S. Census Bureau and authors’ calculations.
NOTE: The ad valorem shipping cost is calculated by taking the ratio between the cost, insurance and freight (CIF) import value and “free on board” import value, and subtracting 1. Industries are defined by the North American Industry Classification System.
We found that shipping costs are increasing in the size of the goods being shipped, and decreasing in their value. For instance, goods like computers and electronics, or chemicals, which are relatively small but of high value, tend to have low shipping costs. In contrast, goods that are relatively large and of low value, like furniture or livestock, tend to have high shipping costs. The heterogeneity in shipping costs across industries is even larger than across countries: In industries like furniture, or minerals and ores, shipping costs account for more than 8% of total import value, while they account for less than 2% of total imports for computers and electronics, or chemicals.
However, there are some exceptions to these patterns. Spain, for example, is among the countries with the highest shipping costs despite being relatively close to the U.S. Spain’s high shipping costs are accounted for by the industry composition of its exports to the U.S. Producing over half of total U.S. imports from Spain, the top four industries are chemicals, transportation equipment, agricultural products, and oil and gas. The latter two industries have relatively high shipping costs.
There are also exceptions in the cross-industry patterns. For instance, we observe that nonelectrical machinery is among the five industries with the lowest shipping costs. This is somewhat counterintuitive given nonelectrical machinery can be quite large and have low value relative to its size. However, this pattern is accounted for by the country composition of U.S. imports of these goods: The top two importing countries of nonelectrical machinery are Mexico and Canada, importing over one-third of the total amount from 2014 to 2019. Thus, a large number of these goods are imported from a very close destination, and are thus cheaper to ship.
We conclude that there is significant heterogeneity in shipping costs across both countries and industries. These findings suggest that changes in international shipping costs following large shocks such as COVID-19 have likely had heterogeneous impacts across import sources and industries: The unprecedented surge of shipping costs has likely had a greater impact on imports from distant sources, as well as for imports of large, low-value goods. These are critical considerations when examining the impact of fluctuations in international shipping costs.
Notes
- See George A. Alessandria, Shafaat Y. Khan, Armen Khederlarian, Carter B. Mix and Kim J. Ruhl’s 2023 working paper “The Aggregate Effects of Global and Local Supply Chain Disruptions: 2020-2022,” and Jason Dunn and Fernando Leibovici’s 2023 working paper “Navigating the Waves of Global Shipping: Drivers and Aggregate Implications.”
- See USA Trade Online.
- For an overview of the recent literature on shipping costs, see Adina Ardelean, Volodymyr Lugovskyy, Alexandre Skiba and David Terner’s 2022 working paper “Fathoming Shipping Costs: An Exploration of Recent Literature, Data, and Patterns.”
- These are all the countries that made up a share of at least 0.5% of total U.S. imports between 2014 and 2019.


Citation
Jason Dunn and Fernando Leibovici, ldquoHow U.S. Import Shipping Costs Vary across Countries and Industries,rdquo St. Louis Fed On the Economy, April 17, 2023.
This blog offers commentary, analysis and data from our economists and experts. Views expressed are not necessarily those of the St. Louis Fed or Federal Reserve System.
Email Us
All other blog-related questions