


Estimating the Affordability of Child Care across U.S. States
Center-based child care continues to be a major expense on working families across the U.S., and for many other families, care is not even available in their communities. As a consequence, parents utilize various approaches to care, such as part-time care, home-based centers, grandparents or older siblings. A result of this mix-and-match approach to child care is that it's difficult to fully understand the cost of providing center-based child care (e.g., state-licensed daycare centers). Surveys of out-of-pocket expenses paid by families may understate costs if a family utilizes multiple resources (e.g., grandparents twice a week).
Moreover, if a child care center operates with state or federal subsidies, the survey-based measures of prices paid can understate the overall costs. There are many other reasons, such as selection biasFor example, high-income families are more likely to pay for child care and may choose higher-quality facilities, while lower-cost (lower-quality) centers may have capacity. So the price paid by families may not reflect the cost of providing care. or variation in quality, that can lead to distorted survey-based estimates. To address these issues, we developed a simple framework for estimating the cost and affordability of center-based child care across U.S. states.
We estimated that the states with the highest average child care cost include Vermont, New York and Connecticut.Washington, D.C., is much costlier, with the average child care cost being approximately $17,000. States with the lowest costs include Mississippi, Louisiana and Georgia. Based on these cost estimates and measures of family income, we found that child care was least affordable in Vermont and Maine, and most affordable in Utah and Georgia.
Measuring Costs and Affordability
Due to the nature of the work, labor costs are the key driver of costs for child care centers. We measure labor costs using state-level wages of nonsupervisory workers in the child care sector; we also include a 25% markup for taxes and benefits paid by the employers. Labor costs are allocated to families using state-required maximum child-to-staff ratios, which vary by state and age.This cost calculator specifically uses the child-to-staff ratios for infants (younger than 12 months), toddlers (1-3 years), and preschool-aged children (3-5 years). Idaho is not included in the calculations, as it does not have legally defined child-to-staff ratios, according to the Office of Child Care.
Due to lack of available data on cross-state variation in other costs, we make assumptions about overhead costs and center utilization rates based on national data. Overhead costs vary by state but are assumed to equal 40% of overall child care costs.For more details on cost structures of centers, see Figure 3 in the U.S. Treasury report The Economics of Child Care Supply in the United States (PDF), September 2021. Center utilization is assumed to be fixed at 90%; this assumption is primarily due to seasonality with children entering kindergarten in the fall and staggered birth dates creating logistical challenges that leave centers below 100% capacity. Using this framework, we can estimate the costs of providing center-based child care across U.S. states and Washington, D.C.
We measure affordability as child care costs relative to median income of those families with at least one child under 5 years old.By setting this cost measure as a percentage of the median household income in each state and Washington, D.C., child care affordability can be calculated. Median U.S. household income is calculated using the family total income variable from the American Community Survey. We found that nationally this median household could expect to spend about 14% of their income on center-based care for a single child.
Looking deeper at households likely to pay for care, we focus on two-parent householdsTwo-parent household is defined as a household with two married spouses who are both present in the home with at least one child under the age of 5 in the home. and single-parent householdsSingle-parent household is defined as never married/widowed/separated/married but spouse absent/single with a child under the age of 5 in the home. in which all adults are employed full time. For two-income households, child care takes up about 10% of income; for single-income households, child care takes up about 32% of income.
Understanding the Drivers of Child Care Affordability
There is a negative relationship between child care affordability and the average child-to-staff ratio in each state. States with lower child-to-staff ratios may indicate a potential higher quality of child care because each caregiver has fewer children to care for; this leads to more one-on-one attention, a common metric for quality of care. This negative relationship suggests trade-off between quality child care and affordability across states as portrayed in the figure below.
Average Child-to-Staff Ratio and Affordability
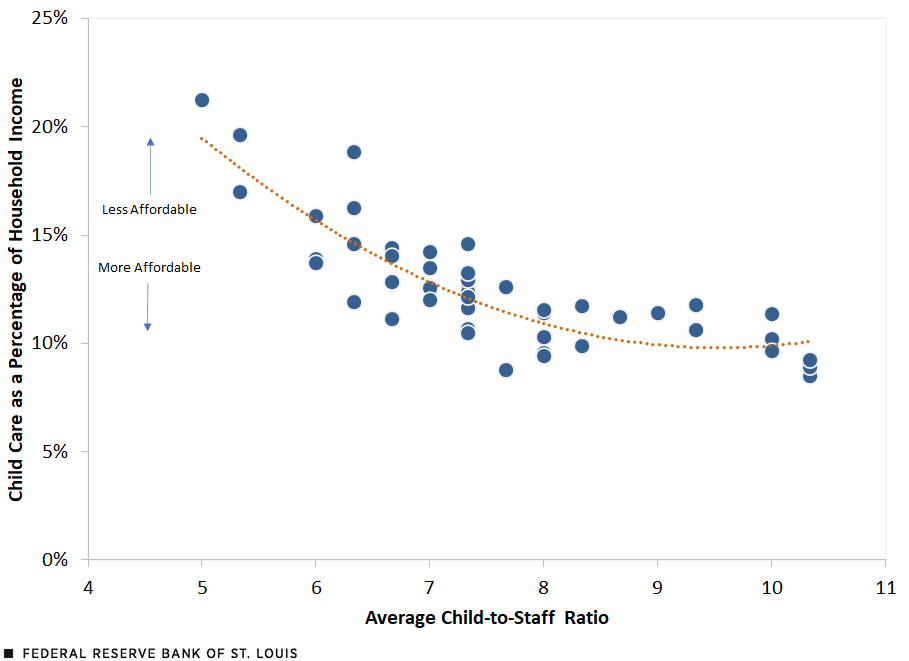
SOURCES: IPUMS USA, Child Care Technical Assistance Network and authors’ calculations.
NOTES: Affordability is child care costs as a percentage of median income of certain families with at least one child under 5 years old; these are two-parent households and single-parent households in which all adults are employed full time. The dotted orange line is the trend line. Data are for individual states (except Idaho) and Washington, D.C., in 2019.
The second key driver of child care affordability in this model is wages in the child care sector. All else constant, higher wages would indicate a higher cost of care. However, wages for many occupations vary across the nation, due to factors like the cost of living. So to better understand differences in labor costs, we construct a wage ratio, which is the wage of child care workers relative to all other private sector workers in the state. As this ratio increases, child care workers' wages approach the average wage in the state. Relatively higher wages are one way to attract higher quality workers into an occupation; as such, this wage ratio is another proxy for the quality of care.
Our analysis again found an adverse trade-off between relative wages and affordability, with relatively higher wages associated with less-affordable child care as shown in the figure below. Across all states, child care workers' wages are significantly lower than the average private sector worker, ranging from 46 cents to 68 cents on the dollar.
Relative Wages and Affordability
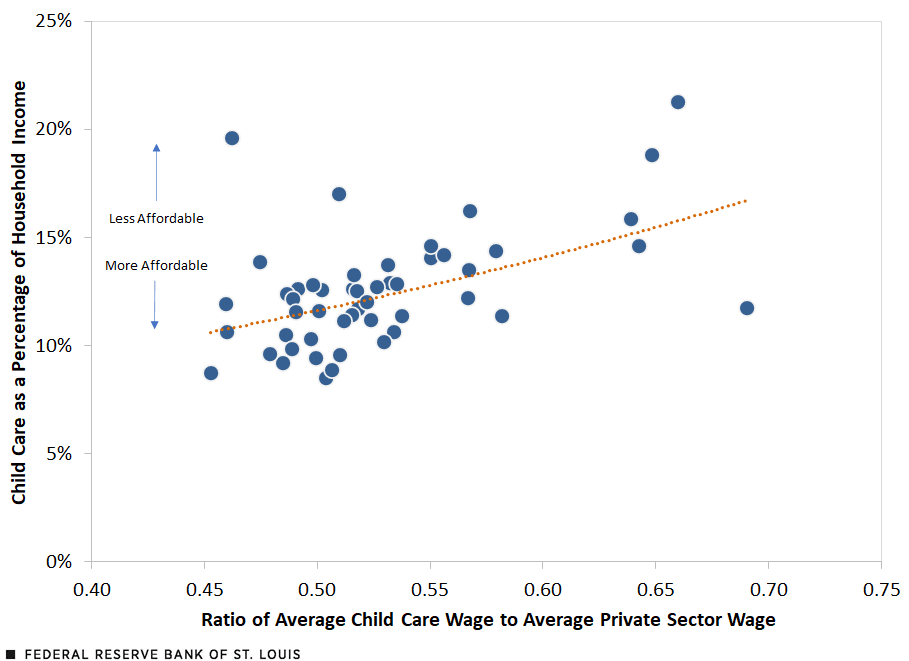
SOURCES: IPUMS USA, Child Care Technical Assistance Network and authors’ calculations.
NOTES: Affordability is child care costs as a percentage of median income of certain families with at least one child under 5 years old; these are two-parent households and single-parent households in which all adults are employed full time. The dotted orange line is the trend line. Data are for individual states (except Idaho) and Washington, D.C., in 2019.
While these key drivers in our framework point to acute challenges in providing quality affordable child care, it is worth noting that neither relationship is perfectly linear and that significant variations remain across states. Our framework, combined with alternate measures of quality of care, allows future research to examine the optimal relationship between worker wages and child-to-staff ratios to meet quality and affordability goals.
A Closer Look at the Eighth District States
The states that are part of the Eighth Federal Reserve District have relatively lower child care costs, ranging $4,500 to just under $9,000. (See the table below.) In the Eighth District, all the states are generally more affordable than the U.S. average; the states’ values range from 9% to 13% of annual household income required to cover the cost of child care.
In the Eighth District, Mississippi has the lowest child care costs and is the most affordable; this is due to that state having the lowest child care industry wages and the highest average child-to-staff ratios. According to our model, the most expensive state for child care in the Eight District is Illinois, and the least affordable is Missouri.
| State | Median Household Income | Average Child Care Cost | Affordability | Average Child Care Industry Wage | Average Child-to-Staff Ratio |
|---|---|---|---|---|---|
| Arkansas | $52,000 | $6,090 | 11.7% | $10.63 | 8.3 |
| Illinois | $76,000 | $8,828 | 11.6% | $13.28 | 7.3 |
| Indiana | $64,000 | $8,036 | 12. 6% | $11.64 | 7.0 |
| Kentucky | $58,100 | $6,611 | 11.4% | $12.31 | 9.0 |
| Mississippi | $50,100 | $4,617 | 9.2% | $9.34 | 10.3 |
| Missouri | $63,000 | $8,136 | 12.9% | $12.24 | 7.3 |
| Tennessee | $60,500 | $7,738 | 12.8% | $10.93 | 6.7 |
| U.S. | $70,200 | $9,940 | 14.2% | $13.72 | 6.7 |
| SOURCES: IPUMS USA, Child Care Technical Assistance Network and authors’ calculations. | |||||
| NOTE: See appendix for other states and Washington, D.C. | |||||
Using the Model to Understand the Impact of COVID-19 Pandemic on Child Care
As described in previous research, the COVID-19 pandemic had a significant impact on the child care sector, notably through higher costs to providers. COVID-19 exposure risks were extremely high for staff working in close proximity with small children who were unmasked and unvaccinated. This alone led some workers to leave the industry. Meanwhile, expanded unemployment insurance benefits, initially equivalent to earning $15 per hour, were much higher than the average wage of child care workers in many states.
These factors made it increasingly difficult to recruit and retain staff, and they also increased labor costs. Using our model, we estimate a scenario in which the industry’s hourly wage is lifted to $15 from $13.72; in that case, the average child care cost would rise to $10,867 from $9,940.
In addition, overall utilization of centers declined because of parents temporarily removing children and social distancing restrictions that limited capacity at centers in some states and localities. We estimate that if center capacity declined from 90% to 75%, this alone would increase the cost of providing child care from $9,940 to $11,927. Combining only these two factors, national costs would increase to $13,041 from $9,940, a 31% hike.
Federal support to businesses and child care centers (e.g., Paycheck Protection Program loans) may have offset some of these costs in the short-term, but centers continue to face increasing costs due to higher overall inflation. So far, centers have been managing these costs; daycare and preschool inflation has remained relatively modest, increasing only 3.2% between July 2021 and July 2022.
Supporting Full Capacity Could Help Reduce Costs
Our analysis identifies very acute challenges in improving the affordability of center-based child care—as some of the key drivers of costs are also associated with better quality of services—while also raising broader economic equity concerns.
Child care workers are among the lowest-paid occupations. Raising wages would help attract more people into a very demanding job, but this also could reduce affordability absent an increase in household incomes. Forms of household assistance, such as child care subsidies to households, may have adverse effects in the long run by increasing the demand for child care when supply is limited, thus pushing up prices; in this case, affordability could remain unchanged.
The model highlights the value of supporting full capacity of centers as a way to reduce costs. For example, employers could consider paying for vacant spots at a particular center for their workers who need care in the future. This would directly benefit businesses by allowing their employees to return to work while also reducing costs for all families who send children to that center as effective capacity would remain higher.
Government assistance to the centers to mitigate the cost of seasonal enrollment declines could also reduce costs, but this may also create adverse incentives for operating at lower capacity; centers would have less incentive to fill vacant spots. Meanwhile, our model is not explicit on drivers of overhead costs, which remain substantial; reductions in overhead costs could also cut costs today and reduce barriers to entry in the market, thereby increasing supply. For example, locating centers in order to utilize surplus office space would be another approach to reducing overhead costs while providing additional reasons for workers to return to the office.
Notes
- For example, high-income families are more likely to pay for child care and may choose higher-quality facilities, while lower-cost (lower-quality) centers may have capacity. So the price paid by families may not reflect the cost of providing care.
- Washington, D.C., is much costlier, with the average child care cost being approximately $17,000.
- This cost calculator specifically uses the child-to-staff ratios for infants (younger than 12 months), toddlers (1-3 years), and preschool-aged children (3-5 years). Idaho is not included in the calculations as the state does not have legally defined child-to-staff ratios, according to the Office of Child Care.
- For more details on cost structures of centers, see Figure 3 in the U.S. Treasury report The Economics of Child Care Supply in the United States (PDF), September 2021.
- By setting this cost measure as a percentage of the median household income in each state and Washington, D.C., child care affordability can be calculated. Median U.S. household income is calculated using the family total income variable from the American Community Survey.
- Two-parent household is defined as a household with two married spouses who are both present in the home with at least one child under the age of 5 in the home.
- Single-parent household is defined as never married/widowed/separated/married but spouse absent/single with a child under the age of 5 in the home.
Fact Sheets: Economic Impact of Child Care by State
View infographics with child care data for all 50 states, including:
- child care affordability estimates
- data on the percentage of single parents
- labor force participation rates
- statistics about workforce-related struggles facing child care providers
Fact sheets prepared by Federal Reserve Bank of St. Louis researchers.
Appendix: Data for Other States and Washington, D.C.
| State | Median Household Income | Average Child Care Cost | Affordability | Average Child Care Industry Wage | Average Child-to-Staff Ratio |
|---|---|---|---|---|---|
| Alabama | $58,000 | $7,829 | 13.50% | $12.25 | 7.00 |
| Alaska | $76,900 | $9,696 | 12.61% | $14.71 | 7.00 |
| Arizona | $64,420 | $7,220 | 11.21% | $12.83 | 8.67 |
| Arkansas | $52,000 | $6,090 | 11.71% | $10.63 | 8.33 |
| California | $80,000 | $10,114 | 12.64% | $14.49 | 7.33 |
| Colorado | $80,500 | $9,825 | 12.20% | $15.72 | 7.33 |
| Connecticut | $86,500 | $12,009 | 13.88% | $14.23 | 6.00 |
| Delaware | $75,100 | $7,997 | 10.65% | $12.03 | 7.33 |
| District of Columbia | $90,000 | $17,637 | 19.60% | $19.96 | 5.33 |
| Florida | $61,100 | $6,947 | 11.37% | $12.34 | 10.00 |
| Georgia | $66,000 | $5,614 | 8.51% | $12.02 | 10.33 |
| Hawaii | $90,000 | $8,598 | 9.55% | $13.47 | 8.00 |
| Illinois | $76,000 | $8,828 | 11.62% | $13.28 | 7.33 |
| Indiana | $64,000 | $8,036 | 12.56% | $11.64 | 7.00 |
| Iowa | $67,350 | $9,239 | 13.72% | $12.09 | 6.00 |
| Kansas | $68,000 | $8,416 | 12.38% | $10.89 | 7.33 |
| Kentucky | $58,100 | $6,611 | 11.38% | $12.31 | 9.00 |
| Louisiana | $55,600 | $4,944 | 8.89% | $10.76 | 10.33 |
| Maine | $62,000 | $11,666 | 18.82% | $15.11 | 6.33 |
| Maryland | $93,000 | $11,084 | 11.92% | $13.30 | 6.33 |
| Massachusetts | $93,000 | $11,702 | 12.58% | $15.86 | 7.67 |
| Michigan | $65,400 | $7,944 | 12.15% | $11.95 | 7.33 |
| Minnesota | $80,700 | $9,685 | 12.00% | $14.03 | 7.00 |
| Mississippi | $50,100 | $4,617 | 9.21% | $9.34 | 10.33 |
| Missouri | $63,000 | $8,136 | 12.91% | $12.24 | 7.33 |
| Montana | $61,800 | $8,901 | 14.40% | $12.64 | 6.67 |
| Nebraska | $69,500 | $8,846 | 12.73% | $12.21 | 6.67 |
| Nevada | $65,800 | $7,733 | 11.75% | $15.67 | 9.33 |
| New Hampshire | $84,000 | $8,802 | 10.48% | $12.61 | 7.33 |
| New Jersey | $96,000 | $9,062 | 9.44% | $14.41 | 8.00 |
| New Mexico | $56,000 | $5,957 | 10.64% | $12.07 | 9.33 |
| New York | $77,500 | $13,176 | 17.00% | $15.68 | 5.33 |
| North Carolina | $62,000 | $6,311 | 10.18% | $12.36 | 10.00 |
| North Dakota | $74,000 | $11,755 | 15.88% | $15.50 | 6.00 |
| Ohio | $64,300 | $7,332 | 11.40% | $12.25 | 8.00 |
| Oklahoma | $59,440 | $6,868 | 11.55% | $10.76 | 8.00 |
| Oregon | $70,000 | $11,360 | 16.23% | $14.71 | 6.33 |
| Pennsylvania | $70,000 | $9,838 | 14.05% | $13.58 | 6.67 |
| Rhode Island | $77,000 | $11,236 | 14.59% | $15.14 | 6.33 |
| South Carolina | $60,560 | $5,976 | 9.87% | $10.43 | 8.33 |
| South Dakota | $67,000 | $7,465 | 11.14% | $10.56 | 6.67 |
| Tennessee | $60,500 | $7,738 | 12.79% | $10.93 | 6.67 |
| Texas | $68,000 | $6,547 | 9.63% | $11.63 | 10.00 |
| United States | $70,200 | $10,867 | 15.48% | $15.00 | 6.67 |
| Utah | $81,600 | $7,143 | 8.75% | $10.76 | 7.67 |
| Vermont | $67,000 | $14,243 | 21.26% | $16.22 | 5.00 |
| Virginia | $82,800 | $8,528 | 10.30% | $13.56 | 8.00 |
| Washington | $80,600 | $11,446 | 14.20% | $16.58 | 7.00 |
| West Virginia | $54,000 | $7,166 | 13.27% | $10.78 | 7.33 |
| Wisconsin | $71,000 | $9,114 | 12.84% | $12.58 | 6.67 |
| Wyoming | $70,000 | $10,217 | 14.60% | $15.37 | 7.33 |
| SOURCES: IPUMS USA, Child Care Technical Assistance Network and calculations by Kevin Bloodworth and Charles S. Gascon. | |||||
| NOTES: Affordability is child care costs as a percentage of median income of certain families with at least one child under 5 years old; these are two-parent households and single-parent households in which all adults are employed full time. Data are for individual states and Washington, D.C., in 2019; Idaho was excluded because the state does not have legally defined child-to-staff ratios, according to the Office of Child Care. | |||||


Citation
Kevin Bloodworth II and Charles S. Gascon, ldquoEstimating the Affordability of Child Care across U.S. States,rdquo St. Louis Fed On the Economy, Oct. 6, 2022.
This blog offers commentary, analysis and data from our economists and experts. Views expressed are not necessarily those of the St. Louis Fed or Federal Reserve System.
Email Us
All other blog-related questions