Understanding the Dynamics of Unauthorized Immigration to the U.S.
Unauthorized immigration to the United States is a prominent topic among legislators and the public. But how big is the pool of unauthorized immigrants in the U.S., and has the size of that group changed over time?
Federal Reserve Bank of St. Louis economist and Research Officer Subhayu Bandyopadhyay and Research Associate Praew Grittayaphong examined those questions in a Regional Economist article. They looked at the factors driving unauthorized immigration and observed the source nations contributing to the pool.
“The first question can be addressed by Department of Homeland Security estimates of people in the unauthorized immigration pool,” they wrote. “To answer the second question, we assumed ... that if a greater number of immigrant border encounters are reported by U.S. Customs and Border Protection, this suggests a larger number of attempts to cross the border.”
Principal Factors
The authors pointed out that legal immigration is limited by U.S. policy. However, there is no direct way to restrict unauthorized immigration to a predetermined level beyond border control measures.
“As long as ‘push’ factors (such as poverty or violence in source nations) and ‘pull’ factors (like good job opportunities in the U.S.) are strong enough, some potential immigrants will try to cross the border in spite of potential costs that may include payments to smugglers or detention,” Bandyopadhyay and Grittayaphong stated.
They noted that job opportunities drove unauthorized immigration in the U.S. until the 2007-09 recession. Recently, political instability and violence in source nations has contributed to the rise.
Assessing the Pool
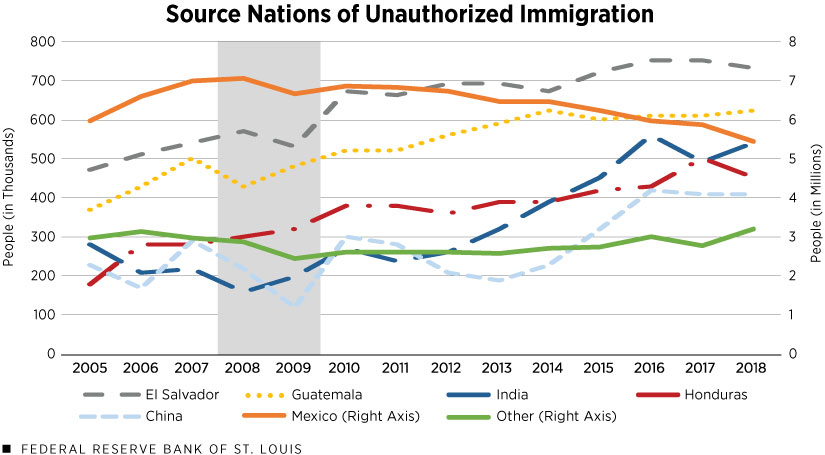
From the 1990s to 2007, the unauthorized immigrant pool grew, but after 2007, the total number stayed flat at about 11.5 million to 12 million people, the authors noted. They wrote that level remained stable state because of a steady decline in the unauthorized pool of those from Mexico and an increase of those from other nations, as highlighted in the first figure.

SOURCES: Department of Homeland Security Office of Immigration Statistics and authors’ calculations.
NOTE: The shaded area represents the 2007-09 recession.
The authors offered two other observations:
- The large numbers for China and India may reflect the countries’ population size and the fact that these immigrant pools include not only people who crossed the border without authorization but also people who may have overstayed their visas.
- In Central America, nations such as El Salvador, Honduras and Guatemala have dealt with factors such as violence and civil strife that have contributed to the increase.
At the Border
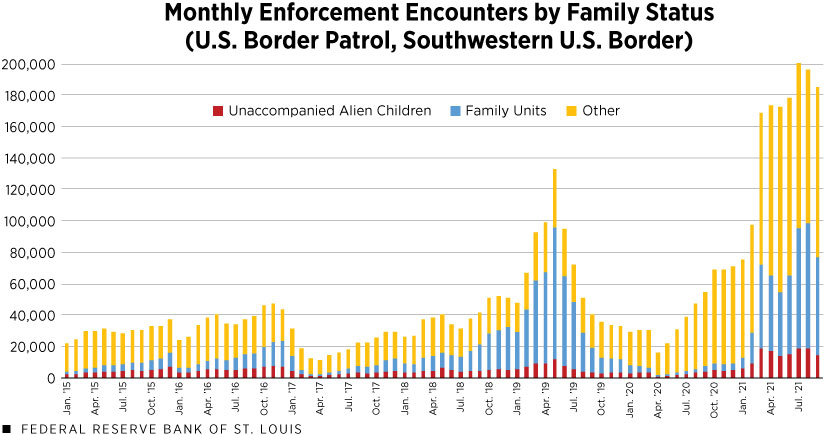
Bandyopadhyay and Grittayaphong also discussed border encounters to examine the flow of unauthorized immigration to the U.S.—specifically along the southwestern border, which has the most unauthorized crossings. The Trump administration worked to reduce the inflow in 2017, and initially, there was a sharp decline that year. Then, border encounters began to rise, depicted in the second figure, because of a sharp rise in enforcement encounters around the middle of 2019. This was driven mostly by ‘Family Units’Family Units represent the number of individuals (either a child younger than age 18, a parent or legal guardian) encountered in a family unit. enforcement encounters, they noted.
“Although precise identification is beyond the scope of this piece, the spike in Family Unit encounters suggests push factors were driving entire families from violence-prone source nations to the perceived safety of a more stable host nation,” they wrote.

SOURCES: U.S. Customs and Border Protection, and authors’ calculations.
NOTE: This information was accessed on Nov. 4, 2021.
The COVID-19 pandemic also affected enforcement encounters, with sharp declines reported by mid-2020. In 2021, the surge in encounters was driven by large numbers in the Family Units category, the authors stated.
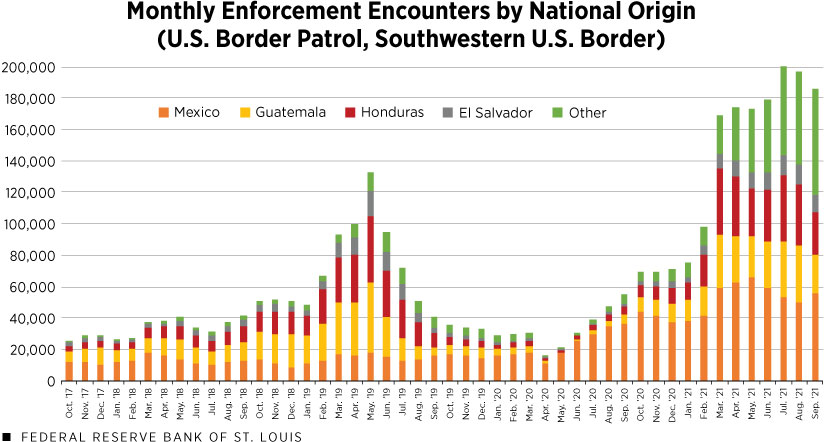
The third figure studies these border encounters and breaks down the source nations of those that were apprehended. Bandyopadhyay and Grittayaphong observed that the increase in overall encounters in most of 2021 was particularly large for people from Guatemala, Honduras and El Salvador.
Though the data are for a short period of time, push factors may have driven families and children from many Central American nations to the U.S., the authors suggested.

SOURCES: U.S. Customs and Border Protection, and authors’ calculations.
NOTE: This information was accessed on Nov. 4, 2021.
Conclusion
Push factors appear to drive unauthorized immigration to the U.S., Bandyopadhyay and Grittayaphong posited, adding that more research is needed to study how poverty, violence and political instability of source nations contribute to the rise.
“While greater enforcement at the border can dampen immigration flows, a durable solution lies in identifying the central push factors and how they can be best addressed by the U.S. in coordination with the source nations of the immigrants,” the authors wrote.
Endnotes
- Family Units represent the number of individuals (either a child younger than age 18, a parent or legal guardian) encountered in a family unit.
Citation
ldquoUnderstanding the Dynamics of Unauthorized Immigration to the U.S.,rdquo St. Louis Fed On the Economy, March 8, 2022.
This blog offers commentary, analysis and data from our economists and experts. Views expressed are not necessarily those of the St. Louis Fed or Federal Reserve System.
Email Us
All other blog-related questions

