Eighth District Businesses Report Stronger Inflationary Pressures
To gain a deeper understanding of the regional economy, the Federal Reserve Bank of St. Louis conducts a quarterly survey of businesses in the Eighth District.Headquartered in St. Louis, the Eighth Federal Reserve District includes all of Arkansas, southern Illinois, southern Indiana, western Kentucky, eastern Missouri, northern Mississippi and western Tennessee. The results of the survey are regularly reported in the St. Louis Fed’s contribution to the Beige Book report on national and regional economic conditions.The Beige Book is a Federal Reserve System publication about current economic conditions across the 12 Federal Reserve districts. The link connects to the St. Louis Fed’s summary within the Beige Book. The St. Louis Fed has conducted this survey on a quarterly basis since May 2014. The key results of the survey are reported alongside the Beige Book report in February, May, August and November. In addition to the standard questions, the St. Louis Fed includes a series of questions on timely topics or areas of specific importance. Since 2018, the St. Louis Fed has included a series of questions on pricing decisions each February. The latest survey was conducted between Feb. 1 and Feb. 11, 2022, and resulted in 180 responses.
With elevated rates of inflation in the economy and widespread interest in factors driving current inflation, this two-part blog series takes a closer look at the survey results pertaining to firms’ prices charged and input costs. The first post will look at the price pressures facing regional businesses, and the second post will focus on their response to this inflationary environment.
Changes in Prices Charged and Input Costs
The foundation of the survey is a series of questions asking firms how a variety of metrics have changed relative to the same period one year ago. Respondents chose “lower,” “about the same” or “higher” for each indicator. The results are reported as the net percentage; that is, the share of respondents reporting “higher” less the share reporting “lower.”For example, if 50% of respondents report “higher,” 30% report “no change” and 20% report “lower,” the net percentage equals 30% (50% minus 20%). A same value would occur if 30% reported “higher,” 70% reported “no change” and 0% reported “lower” (30% minus 0%). The range of possible values is +100% (all respondents indicate “higher”) to -100% (all respondents indicate “lower”).
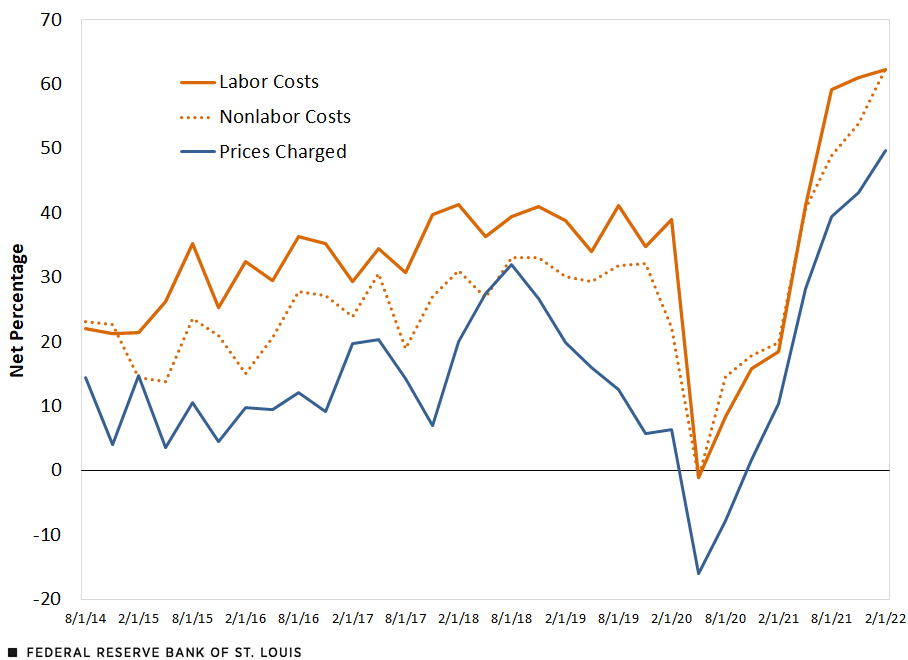
Three survey indicators related to inflation include changes in a firm’s prices charged to customers, nonlabor costs and labor costs. The figure below plots the net percentage of responses for each metric over time.
How Have the Following Measures Changed at Your Firm Relative to the Same Time Last Year?

SOURCE: Federal Reserve Bank of St. Louis.
NOTE: Surveys were conducted during the first two weeks of February of the respective year; therefore, the 2020 survey is considered pre-pandemic.
A few points emerge from the figure:
- The values are above zero during most quarters, indicating a greater share of respondents’ prices are higher than they were one year ago, consistent with stable and modest inflation.
- The lines for labor costs and nonlabor costs are higher than the line for prices charged, indicating that some firms are reporting higher costs but not necessarily increasing prices.Possible interpretations are that these firms are compressing profit margins, using fewer inputs or increasing worker productivity. It’s also possible that respondents replied with a bias, such as being more likely to recall cost increases.
- Inflationary pressures fell sharply at the start of the pandemic, and in May 2020, a slight net share of firms reported lower prices than one year ago.
- Inflationary pressures rose sharply in 2021. On net, 50% of respondents reported charging higher prices than one year ago—the greatest share in the survey’s seven-year history.
The standard questions are useful for a quick gauge of the pulse of economic conditions prior to formal data releases. They are also desirable because of the modest burden they place on respondents by requiring imprecise answers (e.g., “higher” versus “2.2% higher”). However, with this convenience comes less information. To gain a deeper understanding on inflationary dynamics, we include a series of special questions on pricing decisions in each February survey. The following results are obtained from these special questions.
Inflation Surprise of 2021
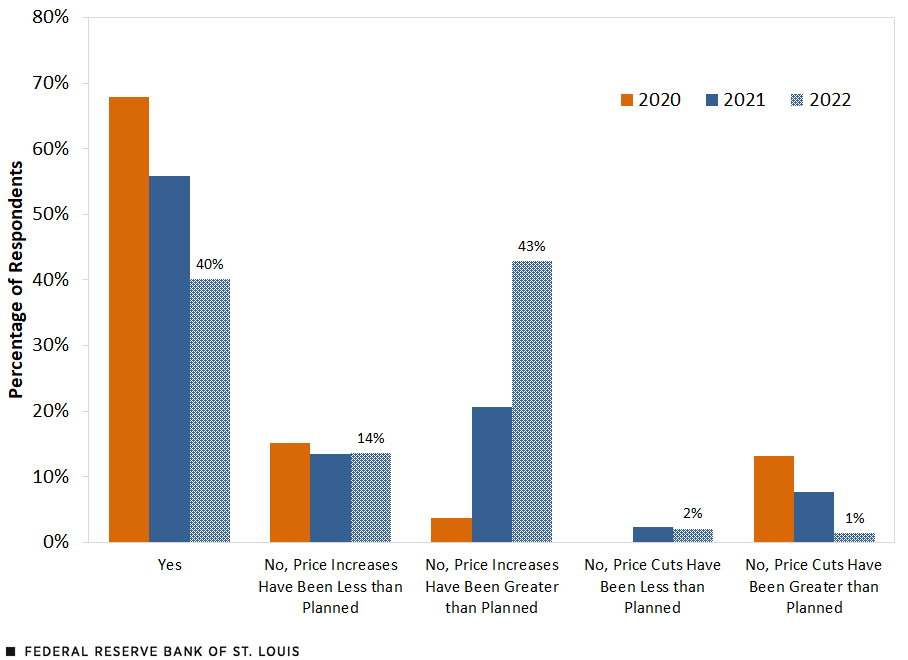
The figure below indicates that in the three-month period ending in February 2022, many firms were not expecting to increase prices to the degree that they planned. In fact, 43% of firms reported that price changes were greater than planned, while only 40% of firms reported that price changes were in line with expectations. Digging into the industry-level data, we see that inflation surprises were broad-based, but they were most notable in the construction sector and among retailers.
Thinking about Prices Charged to Customers, Have Price Changes over the Last Three Months Met Expectations?

SOURCE: Federal Reserve Bank of St. Louis.
NOTES: Surveys were conducted during the first two weeks of February of the respective year; therefore, the 2020 survey is considered pre-pandemic. The 2020 share of respondents answering “No, Price Cuts Have Been Less than Planned” was zero.
The figure also indicates an abrupt shift from the prior two years. The February 2020 survey indicated that price changes during the previous three months were in line with expectations for almost 70% of firms, with some evidence of erosion of pricing power. In the February 2021 survey, we see greater dispersion: Only 56% of firms reported that changes met expectations, with 14% reporting increases by less than planned and 21% reporting increases by more than planned. In another question, firms also indicated a greater ability to increase prices charged, with around 40% of respondents indicating their ability had improved, while only about 20% of respondents noted a deterioration in their ability.
Notes and References
- Headquartered in St. Louis, the Eighth Federal Reserve District includes all of Arkansas, southern Illinois, southern Indiana, western Kentucky, eastern Missouri, northern Mississippi and western Tennessee.
- The Beige Book is a Federal Reserve System publication about current economic conditions across the 12 Federal Reserve districts. The link connects to the St. Louis Fed’s summary within the Beige Book. The St. Louis Fed has conducted this survey on a quarterly basis since May 2014. The key results of the survey are reported alongside the Beige Book report in February, May, August and November. In addition to the standard questions, the St. Louis Fed includes a series of questions on timely topics or areas of specific importance. Since 2018, the St. Louis Fed has included a series of questions on pricing decisions each February. The latest survey was conducted between Feb. 1 and Feb. 11, 2022, and resulted in 180 responses.
- For example, if 50% of respondents report “higher,” 30% report “no change” and 20% report “lower,” the net percentage equals 30% (50% minus 20%). A same value would occur if 30% reported “higher,” 70% reported “no change” and 0% reported “lower” (30% minus 0%). The range of possible values is +100% (all respondents indicate “higher”) to -100% (all respondents indicate “lower”).
- Possible interpretations are that these firms are compressing profit margins, using fewer inputs or increasing worker productivity. It’s also possible that respondents replied with a bias, such as being more likely to recall cost increases.
Citation
Charles S. Gascon, ldquoEighth District Businesses Report Stronger Inflationary Pressures,rdquo St. Louis Fed On the Economy, March 31, 2022.
This blog offers commentary, analysis and data from our economists and experts. Views expressed are not necessarily those of the St. Louis Fed or Federal Reserve System.
Email Us
All other blog-related questions


