Self-Employment Grows during COVID-19 Pandemic
U.S. workers faced severe job losses and dramatic changes in the labor market during the COVID-19 pandemic. As a result, many were forced to reconsider their work lives, which contributed to an all-time high quit rate in November and December 2021, when 3% of employed workers quit their jobs.
Self-employment has been commonly thought to provide more flexibility in type, hours and location of work. Thus, the “Great Resignation” may have led to an increase in self-employment. Self-employed workers also represent many of the country’s entrepreneurs, who are responsible for creating jobs for other workers. Unlike other periods of recession and recovery, the COVID-19 pandemic may have also pushed more workers into self-employment because of an increased burden of in-home child care. In this blog post, we explore the prevalence of self-employment in the U.S. economy and how it has evolved over the COVID-19 pandemic.
Basic Trends in Self-Employment
We used microdata from the Current Population Survey (CPS), which interviews individuals for four consecutive months each year. This survey allows us to track the number of self-employed people over time and the characteristics of the self-employed. Respondents are classified as self-employed if they own their own business and operate it for a profit or fee. The self-employed can be further classified as either incorporated or unincorporated, which distinguishes between those who are or are not paid by their own corporation.The Bureau of Labor Statistics counts only the unincorporated self-employed in their official statistics on self-employment. Here, we consider both.
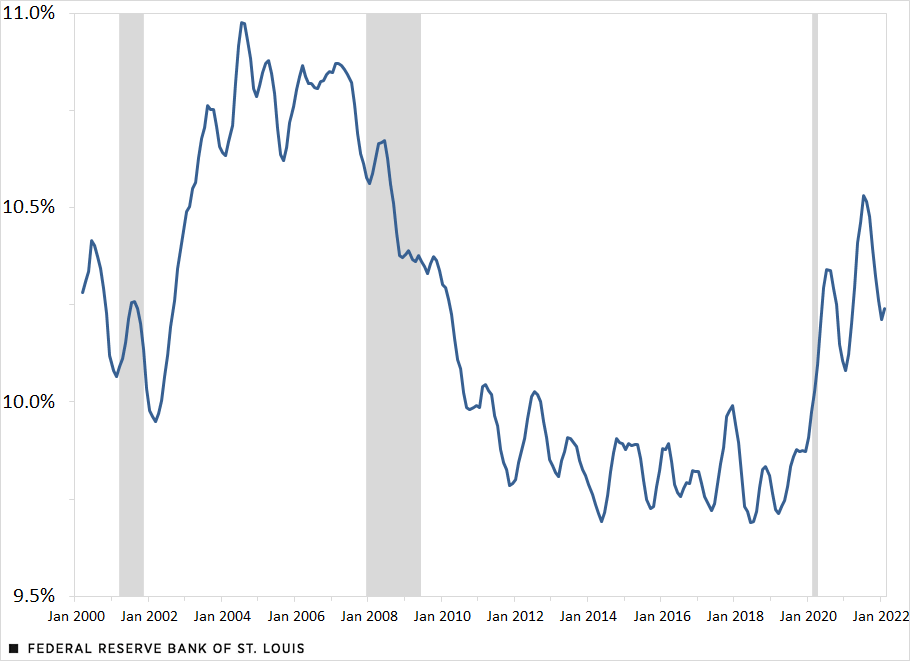
As of February 2022, self-employed workers made up almost 11% of the 157 million employed workers in the U.S. The figure below shows the share (six-month moving average) of the labor force that is self-employed over the past two decades.
Share of U.S. Labor Force That Is Self-Employed
SOURCES: Current Population Survey and authors’ calculations.
NOTES: The data (six-month moving averages) are from March 2000 to February 2022. Shaded areas indicate recessions.
As evidenced by this figure, the share of the labor force that is self-employed increased by about 0.4 percentage points from February 2020 to August 2020. This looks much different from what happened during and after the Great Recession, when the share of self-employed workers decreased.
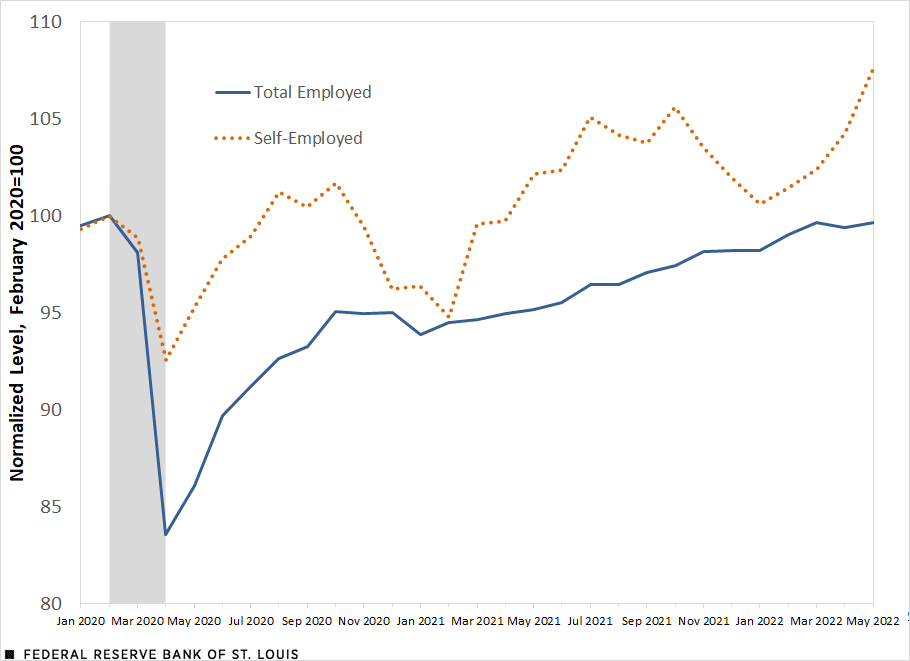
The next figure demonstrates the recovery of self-employment after the onset of the pandemic. By normalizing the number of self-employed and employed workers to 100 in February 2020, we can track the recovery of both. Not only was self-employment less susceptible to initial employment declines than other forms of employment, it also recovered more quickly to pre-pandemic levels by the summer of 2020. Unlike regular employment, it exhibited an additional dip during the winter 2020-2021 wave of the virus, but has since recovered from that as well.
Relative Change in Employment Levels since February 2020
SOURCES: Current Population Survey and authors’ calculations.
NOTE: Shaded area indicates a recession.
Gender and the Move to Self-Employment
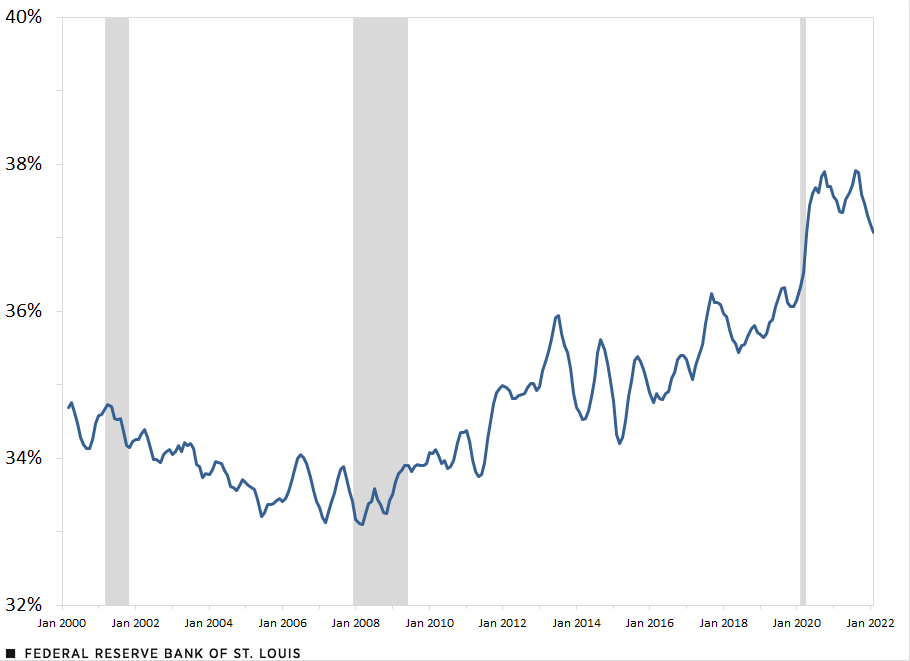
During 2020, women were more likely than men to permanently leave the labor force due to increased child care responsibilities, with over 2.65 million women leaving the workforce between March and September. While self-employment decreased for both men and women during the COVID-19 recession, which began in February 2020 and lasted until April 2020, the makeup of the self-employed workforce shifted toward women during the beginning of the COVID-19 pandemic, as shown by the figure below.
The figure displays the composition of the self-employed workforce by gender over the past two decades. While the share of women in self-employment has been trending upward since 2010, it experienced a sharp increase during the COVID-19 recession. This may suggest that the burden of home and child care placed on women in 2020 made self-employment a more attractive option.
Percentage of Self-Employed Workers Who Are Women
SOURCES: Current Population Survey and authors’ calculations.
NOTES: Data are from March 2000 to February 2022. Shaded areas indicate recessions.
Industry-Specific Patterns
While the self-employed quickly recovered from the initial shock of the pandemic, some industries were hit harder than others. The rest of this post examines the shift in self-employment by industry. In which industries have the self-employed historically worked, and how has this changed over the course of the last two years?
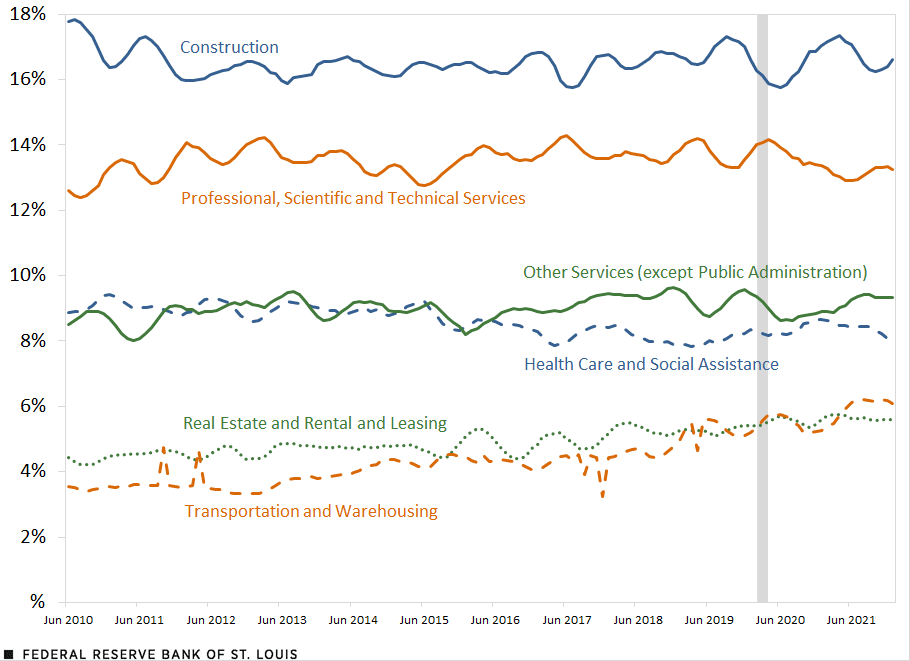
The next figure shows the top six industries in terms of their share of self-employed workers. The construction industry made up the largest share of self-employment: An average of 16.5% of all self-employed workers from February 2020 to January 2022 were in this industry. The professional, scientific and technical services industry had the second largest share, accounting for an average of 13.5% of self-employment. These industries, along with health care and other services,According to the Bureau of Labor Statistics, the industry “Other Services (Except Public Administration)” includes service-providing industries, such as repair and maintenance, personal and laundry services, grantmaking, and religious and civic organizations. do not exhibit any major long-term trends over the past decade. However, the real estate and transportation industries have become more common sectors for the self-employed to work in, with the growth of transportation in particular being potentially related to the growth in gig economy apps like Uber. These trends were not interrupted by the pandemic.
Self-Employment Broken Down by Industry
SOURCES: Current Population Survey and authors’ calculations.
NOTES: Data are from June 2010 to January 2022. Shaded area indicates a recession.
Are Workers Shifting to Self-Employment to Avoid Vulnerable Industries?
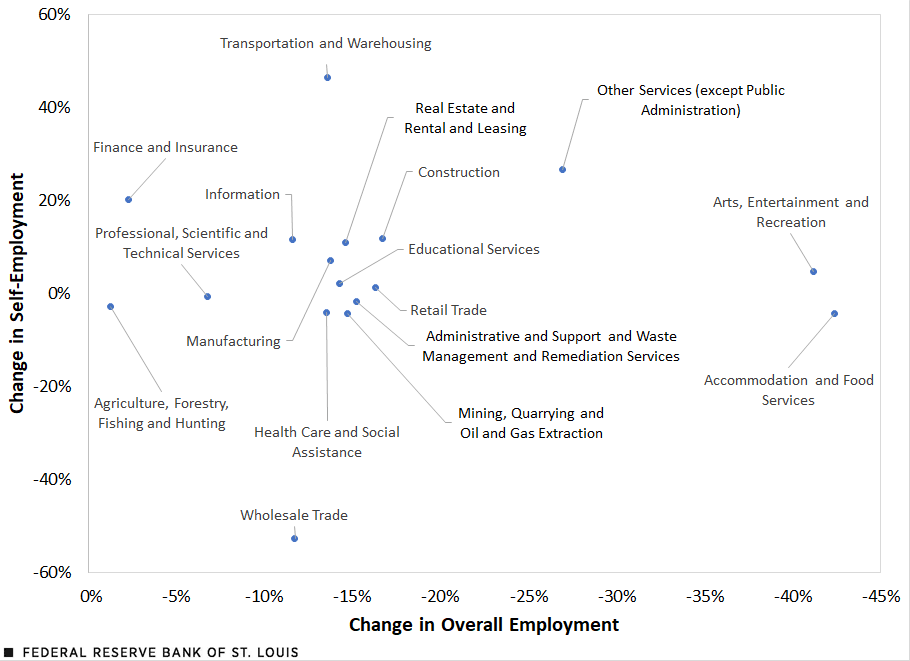
Finally, we analyzed whether workers have shifted into self-employment as a way to avoid more vulnerable sectors or jobs that may be more sensitive to pandemic-related shutdowns or contractions. The next figure, however, suggests that this is not the case. Plotting the drop in overall employment against the growth in self-employment within industries demonstrates no discernible pattern.
If workers moved into self-employment within industries that are less susceptible to recessions, we would expect industries with the smallest decline in overall employment to experience positive increases in self-employment. While this proves true for the finance and insurance industry, which exhibited a decline in overall employment of only 2.3% and a 20.2% increase in self-employment, most industries do not follow this pattern. There are many industries where self-employment has grown despite that industry being hard-hit by the recession (such as other services and construction). Overall, the figure suggests that self-employment growth in specific industries is not driven by the cyclical behavior of that industry, but by some other attribute of the type of work done in those industries.
Percent Change in Employment by Industry
SOURCES: Current Population Survey and authors’ calculations.
NOTES: The percent change in overall employment is for the pandemic recession (February 2020 to April 2020). To calculate the change in self-employment, we took the difference between average self-employment during the past three months (March 2022 to May 2022) and self-employment in April 2016, and then divided that by the self-employment in April 2020 to calculate the percent change.
Conclusion
The incidence of self-employment has increased over the past few years, reversing a downward and then constant trend over the previous decade. In terms of cyclical attributes, because small-business owners typically lack large cash reserves, they can be most vulnerable in recessions. However, in the months after the COVID-19 recession, self-employment experienced a more moderate drop in employment than that of regular workers, and it has since recovered more strongly: In July 2021, the percentage of the workforce that was self-employed reached its highest level since August 2008. As the gig economy continues to grow, self-employed workers are on track to become even more relevant drivers of labor market dynamics.
Notes
1 The Bureau of Labor Statistics counts only the unincorporated self-employed in their official statistics on self-employment. Here, we consider both.
2 According to the Bureau of Labor Statistics, the industry “Other Services (Except Public Administration)” includes service-providing industries, such as repair and maintenance, personal and laundry services, grantmaking, and religious and civic organizations.
Citation
Victoria Gregory, Elisabeth Harding and Joel Steinberg, ldquoSelf-Employment Grows during COVID-19 Pandemic,rdquo St. Louis Fed On the Economy, July 5, 2022.
This blog offers commentary, analysis and data from our economists and experts. Views expressed are not necessarily those of the St. Louis Fed or Federal Reserve System.
Email Us
All other blog-related questions


