How Does St. Louis-Area Immigration Differ from National Trends?
The evolving patterns of immigration have shaped the U.S. over centuries. In this blog post, we focus on the St. Louis metropolitan statistical area (MSA) and compare some important aspects of recent immigration to this region with those of the nation as a whole.
We measure immigration by using data on the foreign born available from the 2005-19 American Community Survey (ACS); in our post, we use the terms immigrants and foreign born interchangeably. In our analysis, we first present the data on the share of the foreign born in the population to focus on the scale of immigration. Next, we identify the top source nations of the foreign born; seen in combination with the extant literature on immigration, this can be informative about economic and social issues surrounding evolving immigration patterns.
Finally, we discuss academic specialization among college graduates in the foreign-born population and how that compares with natives. The latter is informative about the potential contributions that the foreign born can make to the skill pools of the area and of the country as a whole.
Immigrant Share of the Population
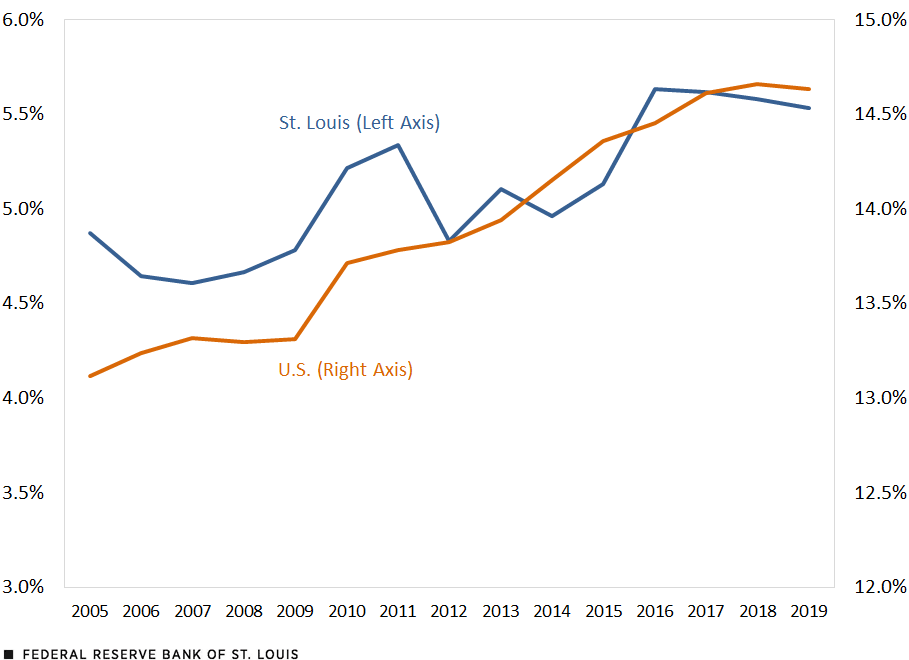
The figure below shows that in 2019 the St. Louis MSA had a much lower share of immigrants, at around 5.5% compared with the national share of 14.6%. In addition, the increase for the MSA between 2005 and 2019 is a modest 0.7 percentage points, compared to the nation’s increase for the same period of 1.5 percentage points.
Foreign Born as a Percentage of Population

SOURCES: American Community Survey, accessed via IPUMS-USA, and authors’ calculations.
Leading Source Nations
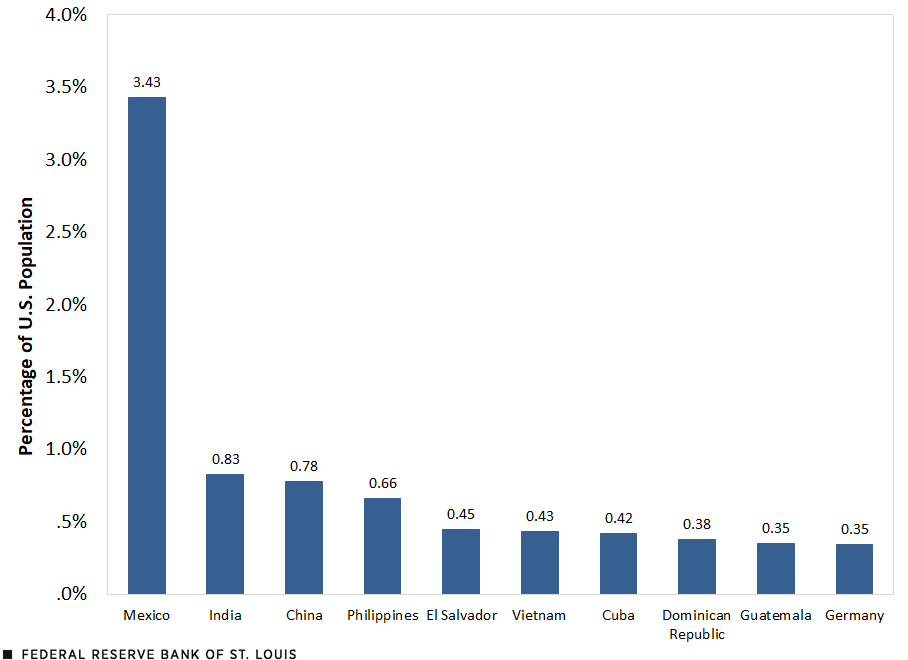
The next figure presents the top 10 source nations of the nation’s immigrants. Mexico is the leading nation, followed by India and China. Out of the top 10, five are from the Americas and four from Asia.
Top 10 Source Nations of Immigrants in the U.S., 2019

SOURCES: 2019 American Community Survey, accessed via IPUMS-USA, and authors’ calculations.
NOTE: China includes Hong Kong and Macau.
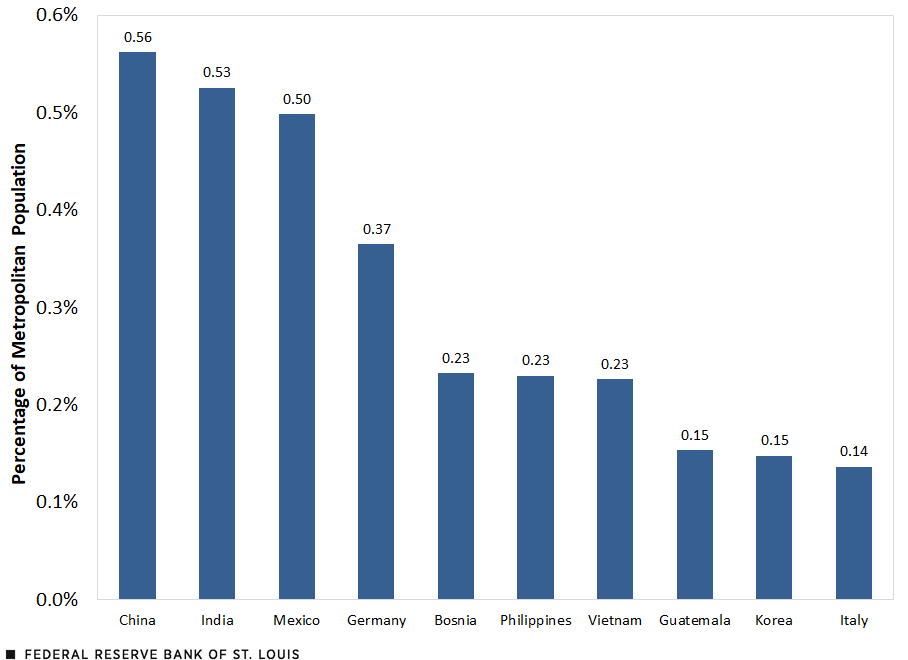
Turning to the St. Louis MSA, we notice a somewhat different pattern, as shown in the third figure. The top two source nations are China and India, with Mexico being the third largest source nation. Five Asian nations are in the top 10, while only Mexico and Guatemala from the Americas feature in the figure.Please see note about Korea under the third figure. Also, in a notable contrast to the figure for the U.S., three European nations feature in the figure for St. Louis.
Top 10 Source Nations of Immigrants in the St. Louis MSA, 2019

SOURCES: 2019 American Community Survey, accessed via IPUMS-USA, and authors’ calculations.
NOTES: China includes Hong Kong and Macau. Korea includes North Korea and South Korea. Refer to the IPUMS website for more information.
What Skills do the Immigrants Have?
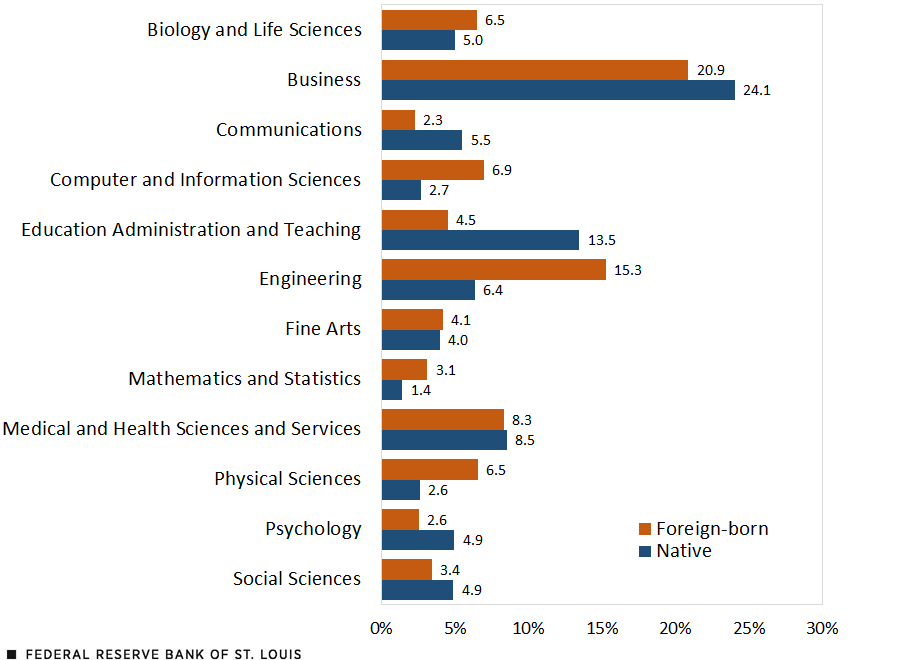
An important issue is to get a sense of the immigrants’ contribution to the U.S. skill pool. In a December 2020 blog post, we presented top fields of academic training of immigrants for the nation as a whole. The next figure presents the corresponding information for the St. Louis area and uses the cited blog for the national level information.
Distribution of Immigrants’ College Degrees among Select Academic Fields in the St. Louis MSA

SOURCES: 2019 American Community Survey, accessed via IPUMS-USA, and authors’ calculations.
NOTE: The data set reports specialization at the bachelor’s degree level for individuals who are 22 or older with a least a bachelor’s degree.
As in the nation, high percentages of both natives and immigrants get business degrees; however, unlike the nation as a whole, natives’ share significantly exceeds the immigrants’ share in the St. Louis area. In engineering, the national and St. Louis comparisons are very similar, with immigrants’ shares substantially exceeding those of natives. In physical sciences, however, immigrants’ share in the St. Louis area is much higher than their share at the national level, while for natives the numbers are similar. Other fields where the St. Louis-area immigrants’ share is markedly higher than those of natives are computer and information sciences, and mathematics and statistics.
Conclusion
The St. Louis area has a relatively low immigrant presence, and it also displays a different composition in terms of where immigrants come from. Broadly in line with the nation as a whole, immigrants with college degrees tend to specialize more than natives in the fields of engineering, physical sciences, and computer and information sciences.
Notes and References
1 Please see note about Korea under the third figure.
Citation
Subhayu Bandyopadhyay and Praew Grittayaphong, ldquoHow Does St. Louis-Area Immigration Differ from National Trends?,rdquo St. Louis Fed On the Economy, Jan. 10, 2022.
This blog offers commentary, analysis and data from our economists and experts. Views expressed are not necessarily those of the St. Louis Fed or Federal Reserve System.
Email Us
All other blog-related questions


