


Have Fed Asset Purchases Reshaped Bank Balance Sheets? Part 1
The Federal Reserve’s acquisition of $4.4 trillion of bonds since February 2020 more than doubled the size of its balance sheet. Meanwhile, commercial banks’ balance sheets expanded by about $4.2 trillion in aggregate. Despite similar expansions, links between the Fed’s and the banking system’s balance sheets are complex.
This blog post, the first in a two-part series, describes how banks have accommodated the very large involuntary increase in their Fed reserve balances that corresponds to Fed asset purchases—first, on the asset side and, in a second post, on the liability side. In this post, I argue that Fed asset purchases did not cause banks to “de-risk” the asset side of their balance sheets. Instead, banks reacted to the lending environment they faced.
The Fed Resumed Large-Scale Asset Purchases after the COVID‑19 Shock
In response to the COVID‑19 shock in early 2020, the Federal Reserve restarted its large-scale asset purchase (LSAP) program, first operated in 2009. In the two years ending Dec. 29, 2021, the Fed increased reserve balances by $4.62 trillion.This quantity is the two-year change in the item “total factors supplying reserve funds” in the Fed’s H.4.1 release. Historical data are available on FRED. This resulted in more than a doubling of the Fed’s balance sheet. The securities share of Federal Reserve regional banks’ consolidated assets increased slightly, from 90.1% to 94.4%.
Large-scale Fed asset purchases do not dictate the size or composition of banks’ balance sheets, but they impose a significant constraint on bank assets. When the Fed purchases Treasury or agency securities from a dealer bank, it pays for the purchase by crediting the bank’s Federal Reserve deposit account in the amount of the purchase. The bank can then use those funds to buy other assets if it chooses to do so, which moves the reserve balances to other banks. But unless and until the Fed removes reserve balances from the banking system, by selling bonds to a dealer bank, those balances will remain on the consolidated balance sheet of the entire banking system.Strictly speaking, banks and other financial institutions with reserve accounts, like government-sponsored enterprises, as well as the Treasury, may convert reserve balances into other Federal Reserve liabilities, such as reverse repurchase agreements or currency. The point remains that only the Federal Reserve can increase or reduce its total liabilities, and it does so primarily through open-market operations settled in banks’ reserve accounts. In other words, banks can and do adjust other asset categories in response to Fed reserve creation.
Banks’ Aggregate Loans-to-Assets Ratio Declined Sharply
The figure below shows that, during the recent period of large-scale asset purchases by the Fed, banks in the aggregate have allowed the share of loans and leases in total assets to decline sharply, while securities and cash assets, including reserve balances at Federal Reserve regional banks, expanded. In fact, the share of loans and leases in total assets has reached its lowest level since 1955, as discussed further below.
Changes in the Composition of Commercial Banks’ Assets: December 2019 to December 2021
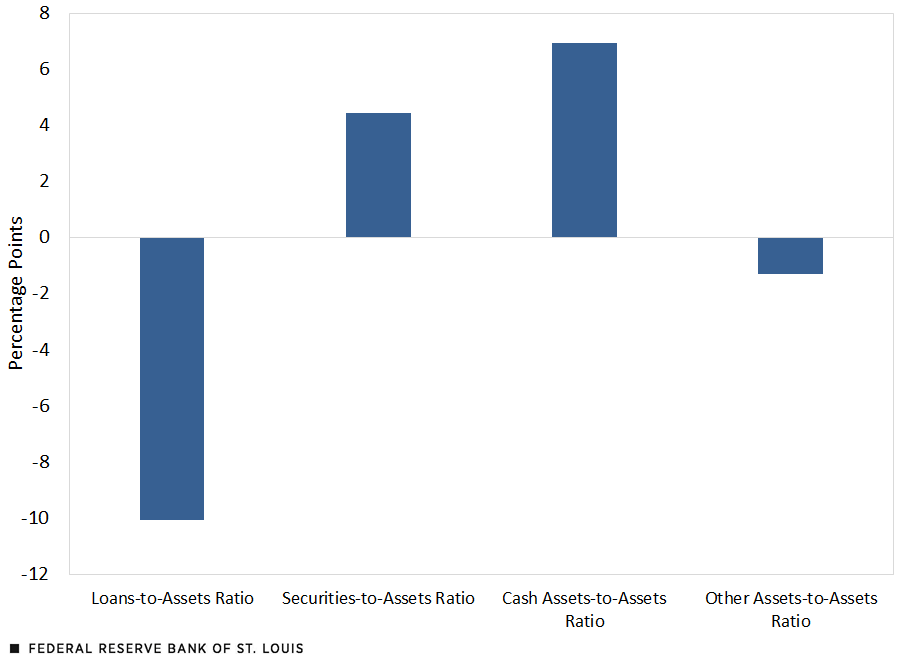
SOURCES: Federal Reserve Board H.8 Release: Assets and Liabilities of Commercial Banks in the United States, and author’s calculations.
NOTES: The figure shows the two-year change ending in December 2021 in the share of banks’ assets held in four categories—loans and leases, securities, cash assets and other assets. The largest increase was in the cash assets-to-assets ratio, followed by the securities-to-assets ratio. The largest decrease was in the loans-to-assets ratio, followed by the other assets-to-assets ratio.
In the financial analysis of an individual bank, a low or falling ratio of loans to assets would suggest the bank is not doing well. This is because loans are typically the highest yielding and most profitable bank asset type. The bank’s net interest margin might be contracting, problem loans might be discouraging new lending, net income could be falling, and the bank might be struggling to maintain adequate capital strength. It could even become the takeover target of a stronger bank. In other words, a very low or rapidly declining loans-to-assets ratio typically is interpreted as a very bad signal for an individual bank.
While it’s true that net interest margins at most banks have declined recently, few of the other problems typically associated with a declining loans-to-assets ratio are evident in aggregate data:
- Loan balances are 6.8% greater than two years ago.Two years ending Dec. 29, 2021. There are minor differences in the two Federal Reserve data sets used in this article in how securities and other assets are classified. In the H.8 release, other assets are somewhat larger and securities somewhat smaller than in the FAOTUS release.
- The shares of noncurrent assets and net loan charge-offs are at multiyear lows (PDF).
- Returns on assets and returns on equity have returned to pre-COVID‑19 levels (PDF).
- The core capital (leverage) ratio remains adequate (PDF), despite rapid growth of total assets.
- No banks failed in 2021 (PDF), and the number of problem banks is below the pre-COVID‑19 level.
Thus, aggregate statistics point to a healthy banking sector despite the plunging loans-to-assets ratio.
Bank Assets Evolved Similarly during the Previous Episode of Fed Asset Purchases
The first two years of large-scale asset purchases after the financial crisis (through year-end 2010) resulted in an increase in Fed securities holdings of $1.66 trillion, but the overall size of the Fed’s balance sheet changed little. This is because several other large crisis-related asset categories on the Fed’s balance sheet declined while securities holdings increased. This might make the immediate postcrisis period less comparable to the present situation.
Indeed, as the figure below shows, bank loans changed little during the initial phase of large-scale asset purchases, although holdings of securities and cash assets increased at the expense of other assets.
Changes in the Composition of Commercial Banks’ Assets: The Great Recession and Recovery
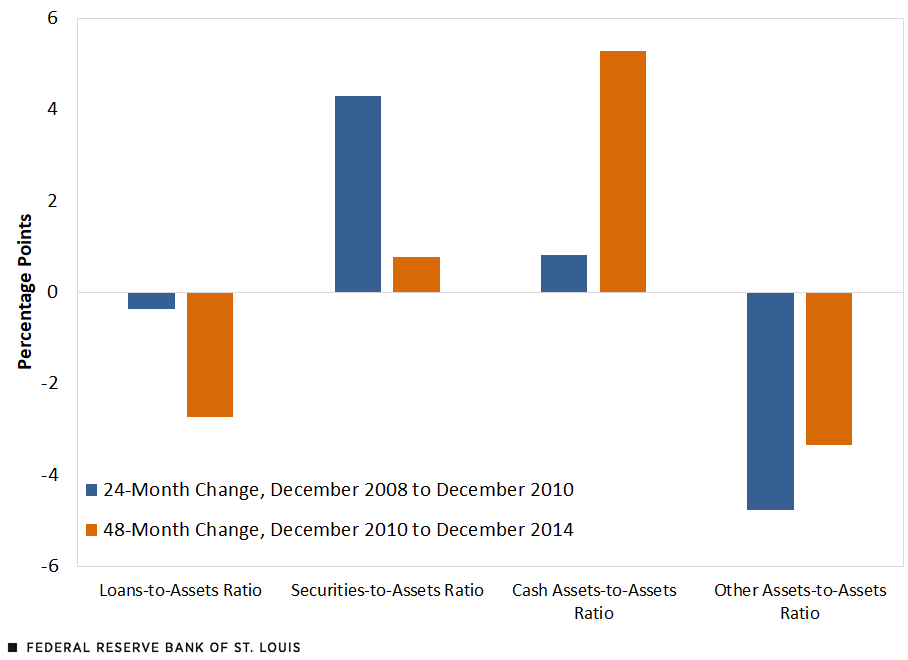
SOURCES: Federal Reserve Board H.8 Release: Assets and Liabilities of Commercial Banks in the United States, and author’s calculations.
NOTES: The figure shows the two-year change ending in December 2010, and the four-year change ending in December 2014, in the share of banks’ assets held in four categories—loans and leases, securities, cash assets and other assets. In the first period, the largest increase was in the securities-to-assets ratio, while the largest decrease was in the other assets-to-assets ratio. In the second period, the largest increase was in the cash assets-to-assets ratio, while the largest decrease was in the other assets-to-assets ratio.
The Fed continued to purchase assets in large amounts after 2010, in what came to be known as “QE2” and “QE3.”These terms refer to “quantitative easing, phase 2” and “quantitative easing, phase 3.” In the four years ending Dec. 31, 2014, the Fed’s securities holdings and total factors supplying reserve funds increased an almost identical $2.7 trillion. As this figure shows, bank loans (and other assets) decreased notably during the second period as securities and cash assets attained larger asset shares. This change in asset composition—away from riskier and less-liquid assets toward less risky and more-liquid assets—closely resembles the pattern seen in the COVID‑19 period.
Changes in Bank Asset Shares since World War II
Taking a longer view, the declining share of loans in banks’ assets associated with recent episodes of Federal Reserve large-scale asset purchases continues a trend visible for several decades before the financial crisis. The aggregate loans-to-assets ratio peaked at 71.8% in late 1979, as the figure below shows. The ratio had declined modestly, on balance, to 64.4% as of June 30, 2008. The subsequent, more rapid decline to 49.1%, as of Sept. 30, 2021, accelerated during the two eras of Fed asset purchases (2009-14 and 2020-21), as described above.
Composition of Depository Institutions’ Assets
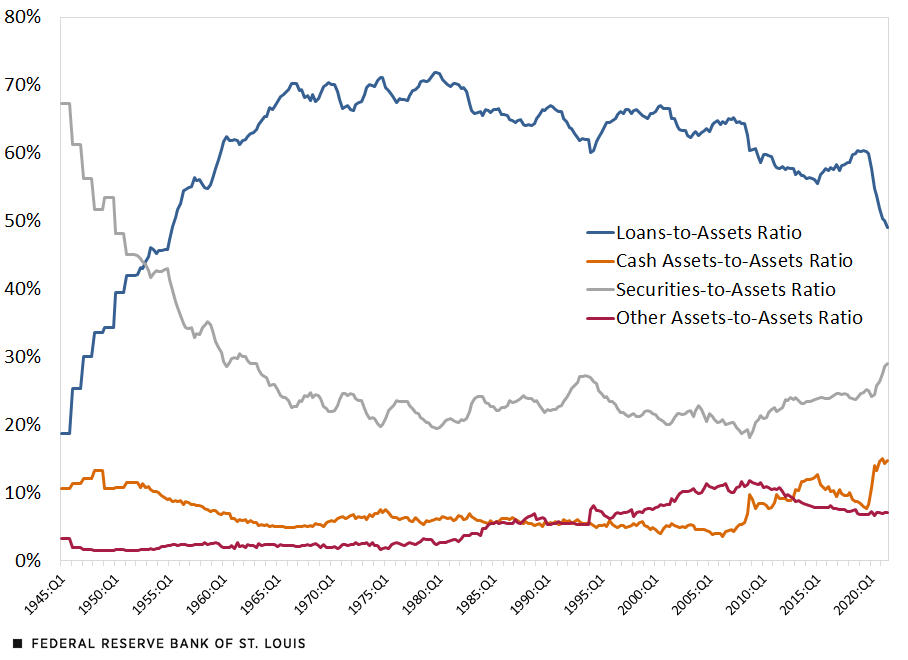
SOURCES: Federal Reserve Board Financial Accounts of the United States (FAOTUS) and author’s calculations.
NOTES: The figure shows the quarterly share in total bank assets of four asset categories between the first quarter of 1945 and the third quarter of 2021. The asset categories are loans and leases, securities, cash assets and other assets. The ratio of loans to total assets increased from only 19% in 1945 to about 70% in 1966. After peaking at almost 72% in 1979, the ratio declined to only 49% in the third quarter of 2021. The ratio of securities to total assets decreased from 67% in 1945 to 20% in 1974; the ratio then fluctuated between 18% and 27% through 2020, moving above that range in 2021. The ratio of cash assets to total assets declined from 13% in 1948 to only 3.6% in 2006. The ratio increased sharply during and after the financial crisis and again during the COVID‑19 crisis, reaching 15% in 2021. The ratio of other assets to total assets increased fairly steadily from under 2% in the late 1940s to a peak of nearly 12% in late 2008. Thereafter, the ratio declined gradually, reaching 7% in 2021.
The counterpart to the declining loan share of bank assets until the financial crisis (from 1979 until mid-2008) was an increase in other assets. Securities and cash assets, meanwhile, remained relatively stable in the four decades that ended in 2008.
Since then, however, securities and cash assets have assumed a greatly enlarged role in bank assets. Between Sept. 10, 2008, and Dec. 29, 2021, securities and cash assets on bank balance sheets increased from $2.4 trillion to $8.6 trillion. As a share of banks’ assets, the increase was from 25.1% to 43.2%.
Why Have Banks Chosen Safer and More-Liquid Assets during Periods of Large-Scale Fed Asset Purchases?
The Federal Reserve’s balance sheet has increased by $7.8 trillion since Sept. 10, 2008, just before the acute phase of the financial crisis began; banks’ assets have increased by $10.2 trillion. Despite the similar change, the composition of banks’ assets is not dictated directly by the Fed’s creation of reserves to support its asset purchases.
In the aggregate, banks have been shifting their assets away from loans and other risky assets, and toward securities and cash assets, for a long time. This pattern accelerated during periods of large-scale Fed asset purchases. Banks thereby became safer and more liquid but potentially less profitable.
Why did banks de-risk their balance sheets especially when the Fed was engaging in large-scale asset purchases? A direct causal link (banks passively accepting higher reserve balances with no offsetting adjustments) is implausible because banks could have increased lending much more if they had wanted to maintain previous balance-sheet ratios. The increase in banks’ securities holdings also reflects intentional bank portfolio choices beyond the Fed’s direct influence.
Instead, the Fed’s LSAP programs and concurrent de-risking of bank balance sheets probably reflect changing regulatory requirements and the economic environment.
- In the aftermath of the Dodd-Frank Act of 2010, banks faced more stringent liquidity standards, which larger cash-asset and securities holdings could satisfy. Enhanced capital and liquidity regulation cannot explain a large decline in the loans-to-assets ratio, however, making this an incomplete explanation, at best.
- Periods of economic and financial volatility—the financial crisis and Great Recession, and the COVID‑19 crisis—necessitated extraordinary Fed policy interventions, including large-scale asset purchases. At the same time, economic and financial stresses may have induced banks to operate with a greater share of low-risk and highly liquid assets, despite the lower profitability this entails.
Thus, concurrent large-scale Fed asset purchases and bank de-risking are more likely coincidentally than causally related.
Notes and References
1 This quantity is the two-year change in the item “total factors supplying reserve funds” in the Fed’s H.4.1 release. Historical data are available on FRED.
2 Strictly speaking, banks and other financial institutions with reserve accounts, like government-sponsored enterprises, as well as the Treasury, may convert reserve balances into other Federal Reserve liabilities, such as reverse repurchase agreements or currency. The point remains that only the Federal Reserve can increase or reduce its total liabilities, and it does so primarily through open-market operations settled in banks’ reserve accounts.
3 Two years ending Dec. 29, 2021. There are minor differences in the two Federal Reserve data sets used in this article in how securities and other assets are classified. In the H.8 release, other assets are somewhat larger and securities somewhat smaller than in the FAOTUS release.
4 These terms refer to “quantitative easing, phase 2” and “quantitative easing, phase 3.”

Citation
William R. Emmons, ldquoHave Fed Asset Purchases Reshaped Bank Balance Sheets? Part 1,rdquo St. Louis Fed On the Economy, Jan. 31, 2022.
This blog offers commentary, analysis and data from our economists and experts. Views expressed are not necessarily those of the St. Louis Fed or Federal Reserve System.
Email Us
All other blog-related questions