


How Uneven Were the Labor Market Recoveries across U.S. States?
Immediately following the onset of the COVID-19 pandemic in the U.S., the national economy experienced a sharp and dramatic decline in the labor market, the kind not seen since the Great Depression. In the three months following January 2020, the unemployment rate increased by 11.2 percentage points.
By U.S. historical standards, the recovery was also very rapid, with the unemployment rate falling 7.8 percentage points by October 2020. Since then, the national recovery has continued, with the unemployment falling another nearly 3 percentage points by December 2021. At the end of the year, the unemployment rate was 0.4 percentage points above its pre-pandemic value.
These national numbers tell only part of the story. In this blog post, we ask how varied the recoveries have been across U.S. states. Examining the state-level indicators matters for several reasons. For an individual, state-level data provide a sharper indicator of their own labor market opportunities than the national numbers alone. Businesses in various regions can use state-level labor data to tailor their own wage and hiring plans. Finally, the nation has a single monetary policy, set by the Federal Reserve, rather than one for each of the 50 states. If the states were at very different points in the business cycle, this could potentially generate tension in how monetary policy should be set.
Unemployment Rates Differ among States
As stated above, the national unemployment rate ended the year 0.4 percentage points above its pre-pandemic level. At the same time, 21 states, making up about one-quarter of the U.S. population, were already at or below their pre-pandemic unemployment rates.Another important metric for economic recovery in the labor market is employment levels, i.e., the number of jobs. Based on employment levels in the Current Employment Statistics, employment in four states has recovered to their January 2020 levels.
To visualize these differences, the figure below plots the percentage point difference in unemployment rates relative to their January 2020 values—i.e., their unemployment rate gaps—for the four states with the strongest and weakest recoveries.
The four strongest-recovery states—Montana, Nebraska, West Virginia and Wyoming—each had a rate that was at least 1.1 percentage points below their pre-pandemic values. The four weakest-recovery states—Hawaii, Nevada, New Jersey and New York—had unemployment rates at least 2.4 percentage points above their pre-pandemic values. In Hawaii, the unemployment rate was still almost triple its January 2020 value.
Changes in Eight States’ Unemployment Rates since January 2020
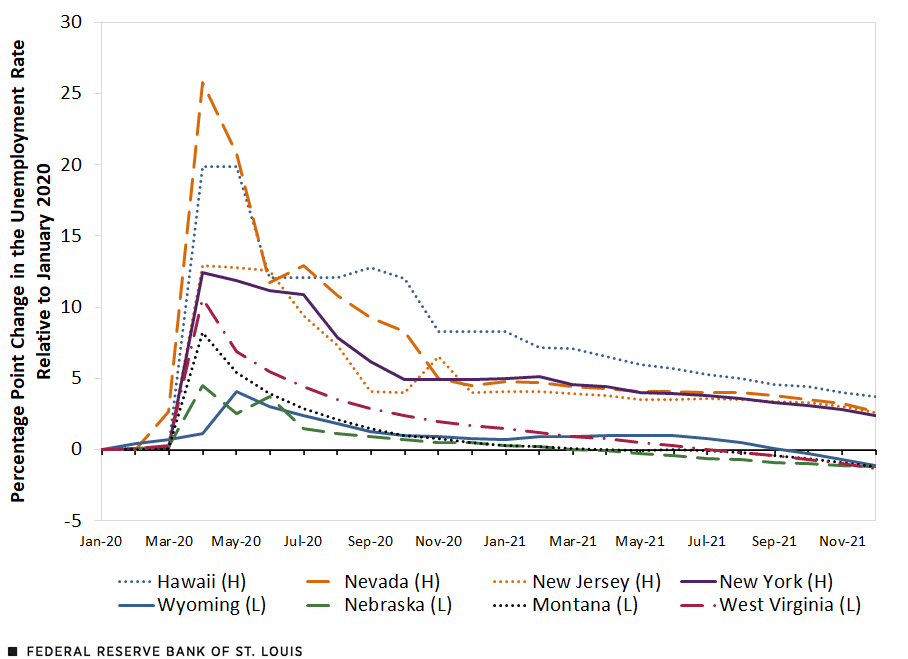
SOURCES: Bureau of Labor Statistics and authors’ calculations.
NOTE: (H) indicates the four states with the highest percentage point increase in unemployment from January 2020 to December 2021, and (L) indicates the four states with the lowest unemployment relative to January 2020.
Industry Mix, Lockdowns and Unemployment Insurance Are Likely Factors
Differences in industry makeup, lockdown severity and state-level unemployment insurance benefit policy likely play a role in the large differences across states. The two states that had the highest employment shares in leisure and hospitality in January 2020, Nevada and Hawaii, have also had the weakest employment recoveries. Looking at lockdown severity, the Oxford COVID-19 stringency index was 27.1% higher on average in December 2021 (meaning that policies were stricter) in the four states with the weakest recoveries compared with the national aggregate. The index was 9.5% lower than the national aggregate in states with strong recoveries.
The four states with the strongest recoveries all halted the federal government’s emergency unemployment insurance benefits several months before the federally mandated end date in September, while none of the four states with the weakest unemployment recoveries halted these benefits early.
Notes and References
- Another important metric for economic recovery in the labor market is employment levels, i.e., the number of jobs. Based on employment levels in the Current Employment Statistics, employment in four states has recovered to their January 2020 levels.


Citation
Iris Arbogast and Bill Dupor, ldquoHow Uneven Were the Labor Market Recoveries across U.S. States?,rdquo St. Louis Fed On the Economy, Feb. 10, 2022.
This blog offers commentary, analysis and data from our economists and experts. Views expressed are not necessarily those of the St. Louis Fed or Federal Reserve System.
Email Us
All other blog-related questions