


The Dynamics of International Shipping Supply
International trade is fundamental to the way in which most countries access a broad variety of goods. They can range from consumption goods that might be easy to substitute with domestic alternatives, to critical production inputs such as semiconductors or rare earth metals that are only supplied by a handful of countries.
A key actor underlying any international trade transaction is the international shipping industry. While typically a well-oiled machine, in the aftermath of the COVID-19 recession the world economy has experienced unprecedented disruptions in international shipping. The most striking evidence of these disruptions is the recent spike in international shipping rates. Over the past year, various indices for global freight rates have nearly quadrupled since late 2019.Containership Spot Freight Rate Series from Clarksons Shipping Intelligence Network. Port congestion has recently been at levels three standard deviations above its pre-pandemic average while delivery times have also surged.Port congestion taken from a series in Clarksons Shipping Intelligence Network. Routes from China to Europe and the U.S., which averaged turnaround times of 60 days before the pandemic, now take around 100 days. See Qiu, Stella; Singh, Shivani; and Khasawneh, Roslan, “Boxed Out: China's Exports Pinched by Global Run on Shipping Containers,” Reuters, Dec. 10, 2020.
Increasing Shipping Supply in the Short Term
To the extent that the supply of shipping capacity is relatively fixed in the short-run, it is likely that some of these disruptions are being driven by the sharp surge of demand across developed economies in the aftermath of unprecedented fiscal and monetary stimulus in these countries during COVID-19.
In this article we examine the dynamics of international shipping supply and investigate the extent to which it can adjust in the short run. If shipping supply can increase relatively rapidly, then the impact of demand pressures on shipping costs is likely to be mitigated and transitory.
To explore these dynamics, we investigated the relation between new orders and deliveries of containerships. We used time series data on new orders and deliveries of containerships with capacity of at least 8,000 20-foot equivalent units, called TEUs, from the Clarksons Research Shipping Intelligence Network database.To measure new orders, we used time series data on total orders pending and deliveries. We calculated new orders from the law of motion for the stock of orders pending: total orders pending in period t+1 are equal to total orders pending in period t plus new orders in period t minus deliveries in period t. (For further details about these data, see the Clarksons website.) We also used data on international shipping costs from a Global Rate Index by Drewry’s maritime research measured in dollars per 40-foot container.This index is recorded at bimonthly frequency from 2006 through 2011 and at a monthly frequency from 2012 to the present. For the first figure, we represent this series annually by taking the yearly mean.
Historical Patterns of New Orders and Deliveries
We began by examining these dynamics historically using annual data from 1997 to 2019. The figure below plots the dynamics of new orders and deliveries along with the dynamics of international shipping costs.
New Orders and Deliveries of Containerships, Pre-Pandemic Period
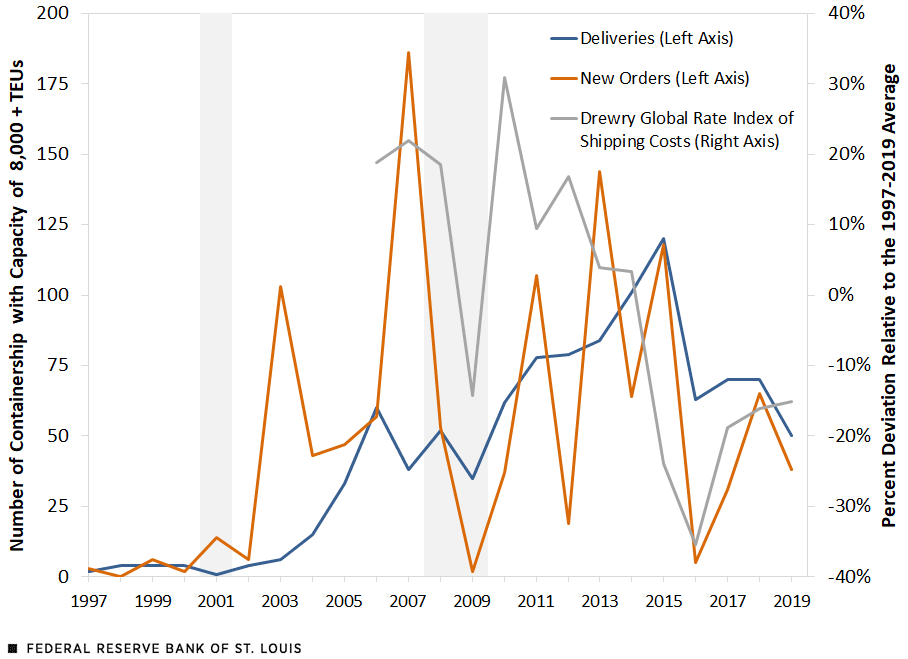
SOURCES: Clarksons Research, Drewry and authors’ calculations.
NOTE: The gray shading indicates years that sustained at least two recessionary months.
Our first observation is that new orders are positively correlated with price changes in the same and previous years, with correlations respectively equal to 0.29 and 0.48. These correlations suggest that periods with relatively higher shipping prices lead the shipping industry to place new orders of ships to increase capacity.
Our second observation is that the deliveries of new ships are negatively correlated with shipping prices in the same and following years, with correlations equal to -0.20 and -0.70, respectively. These correlations suggest that increased shipping supply indeed might be reducing international shipping costs.
Finally, we investigated the speed at which the shipping supply typically adjusts. To do so, we examined the lags involved between new orders and deliveries. We focused on one episode from the first figure: Consider the 2003 spike in new containership orders, 103 new orders compared with the previous year’s level of 6. The level of containership deliveries does not increase contemporaneously, but gradually builds over the following three to five years, bringing in 15, 33, 60, 38 and 52 new ships over 2004-08. A similar trend is observed around the Great Recession. These observations are confirmed quantitatively, with the pre-pandemic correlation between new orders and future deliveries peaking at the fourth year with a value of 0.46.The pre-pandemic correlation values for new orders and deliveries one, two, and three years into the future are 0.41, 0.40, and 0.42, respectively.
These findings show that the supply of ships is relatively rigid in the short-run, and new orders placed in response to a shipping cost surge can take up to four years to materialize in increased shipping supply.
The Dynamics of Shipping Supply since COVID-19
We conclude the article by zooming into the dynamics of new orders, deliveries, and prices observed since the onset of COVID-19 in 2020. To do so, the next figure plots the monthly dynamics of these variables starting a year prior to the start of the pandemic.
New Orders and Deliveries of Containerships, COVID-19 Period
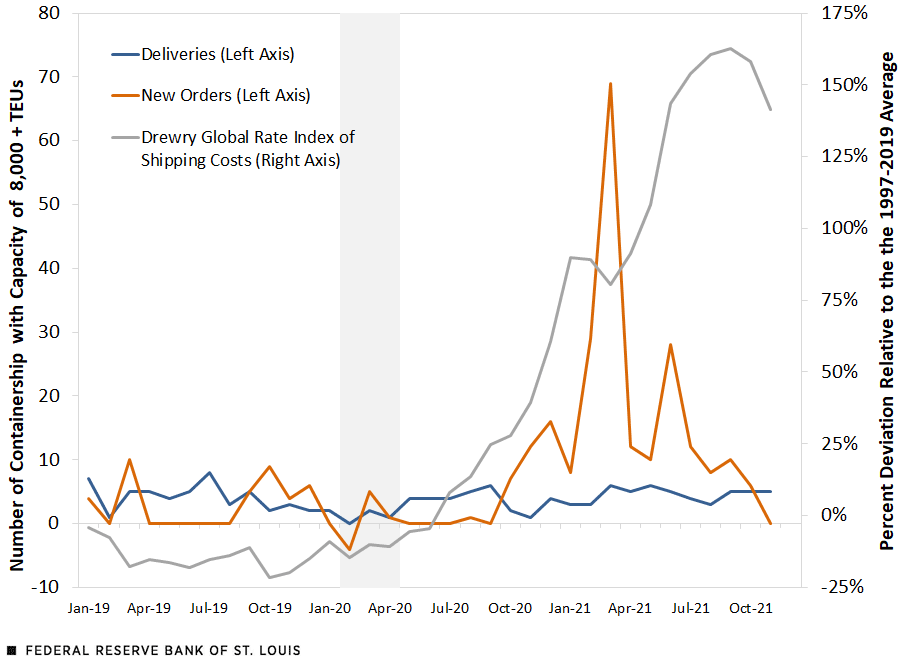
SOURCES: Clarksons Research, Drewry and authors’ calculations.
NOTES: The gray shading indicates the COVID-19 recession. A negative number for new orders is due to cancellations.
We observe a spike of orders for new 8000+ TEU containerships, at a level of 69 new ships ordered in March 2021 compared with 29 in February and 8 in January. Given our findings above on the lags between orders and deliveries, we would expect these new orders to lead to an increase in the deliveries of containerships over the next 3 to 5 years. This expansion in the fleet supply of containerships should ease the existing pressures in international shipping.
The findings that we documented in this article suggest that there is a significant link between shipping supply and shipping prices. Periods in which shipping costs are higher typically lead shipping companies to order new ships. This is what we also observe in early 2021: As shipping prices began to rise, there was a large increase in the number of new orders placed. While these new orders will likely lead to lower shipping prices in the future, as evidenced by the negative link between these prices and containership deliveries, this is expected to take time. As we show above, new orders can take up to four years to be delivered.
Notes and References
- Containership Spot Freight Rate Series from Clarksons Shipping Intelligence Network.
- Port congestion taken from a series in Clarksons Shipping Intelligence Network. Routes from China to Europe and the U.S., which averaged turnaround times of 60 days before the pandemic, now take around 100 days. See Qiu, Stella; Singh, Shivani; and Khasawneh, Roslan, “Boxed Out: China's Exports Pinched by Global Run on Shipping Containers,” Reuters, Dec. 10, 2020.
- To measure new orders, we used time series data on total orders pending and deliveries. We calculated new orders from the law of motion for the stock of orders pending: total orders pending in period t+1 are equal to total orders pending in period t plus new orders in period t minus deliveries in period t.
- This index is recorded at bimonthly frequency from 2006 through 2011 and at a monthly frequency from 2012 to the present. For the first figure, we represent this series annually by taking the yearly mean.
- The pre-pandemic correlation values for new orders and deliveries one, two, and three years into the future are 0.41, 0.40, and 0.42, respectively.


Citation
Jason Dunn and Fernando Leibovici, ldquoThe Dynamics of International Shipping Supply,rdquo St. Louis Fed On the Economy, Feb. 8, 2022.
This blog offers commentary, analysis and data from our economists and experts. Views expressed are not necessarily those of the St. Louis Fed or Federal Reserve System.
Email Us
All other blog-related questions