


Are State Economic Conditions a Harbinger of a National Recession?
A follow-up blog post using new data through November is available.
Economists view recessions as national events. However, past recessions have shown that some states’ economies continued to expand during a recession—particularly when the national recession was relatively mild.For example, see Michael T. Owyang, Jeremy M. Piger and Howard J. Wall’s 2005 article “Business Cycle Phases in U.S. States” in The Review of Economics and Statistics. The Federal Reserve Bank of Philadelphia’s state coincident indexes (SCIs) can be used to assess whether recession-like conditions have developed in each of the states. And if so, whether there is a threshold in the number of states that might signal a national recession.
Tracking State-Level Growth Trends with SCIs
Briefly, the SCIs are calculated with a dynamic single-factor model using each state’s nonfarm payroll employment, average hours worked in manufacturing by production workers, the unemployment rate, and wage and salary disbursements (deflated by the U.S. city average consumer price index). Each state’s SCI trend is also set to match the long-term trend of its gross domestic product (GDP). In other words, for each state, the long-term growth of its SCI matches the long-term growth of the state’s GDP.
The figure below plots, for each month, the number of states that had negative month-over-month growth based on this index.The figure is not an original transformation of the data. Other economic analysts and economists have used versions of these data in a similar fashion. The figure shows that the series has favorable recession-indicator properties; that is, during national recessions, as defined by the National Bureau of Economic Research, the number of states that register negative growth in the SCI increases.
Philadelphia Fed’s State Coincident Indexes: Number of States with Negative Growth
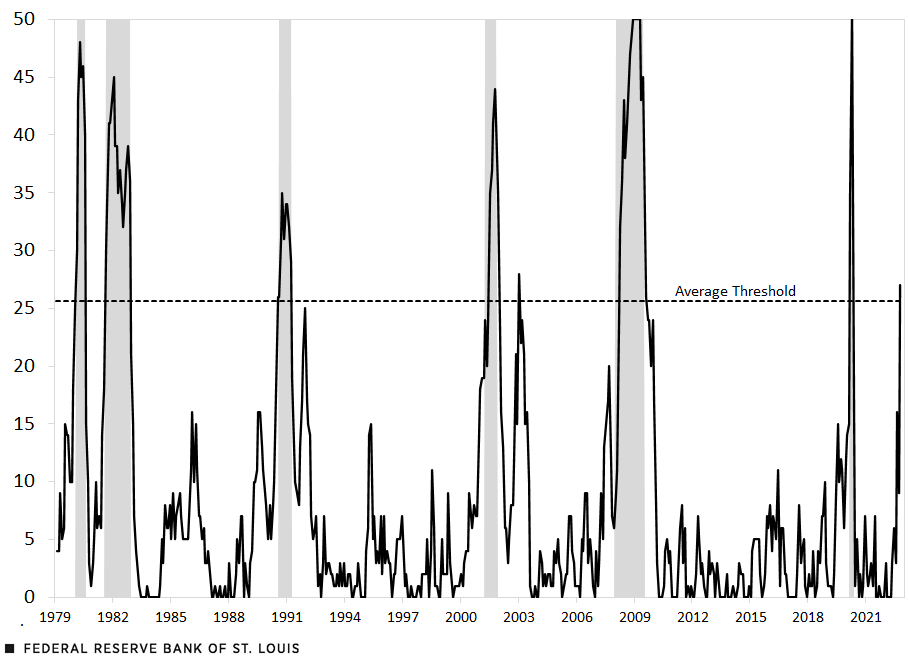
SOURCES: Federal Reserve Bank of Philadelphia and Haver Analytics.
NOTES: The horizontal dotted line represents the average number of states across all episodes experiencing negative growth during the first full month of a national recession. Data through October 2022. Shaded areas represent recessions.
A few key observations can be gleaned from this figure. First, some U.S. recessions were more nationwide than others. All states experienced recession conditions at some point during the 2007-09 and the 2020 recessions, while only about two-thirds of the states experienced negative growth during the 1990-91 recession. Second, there are business expansion periods when a relatively large number of states experience negative growth. This pattern was evident after the 1990-91 and 2001 recessions—which some economists termed “jobless recoveries.”
Using A Threshold of States to Determine Whether the U.S. Is in a Recession
Finally, we can calculate an average threshold, which we define as the number of states that have negative SCI growth during the first month of the national recession—that is, the first full month after the peak of economic activity. For example, the peak of economic activity that marked the start of the 2007-09 recession was in December 2007; thus, January 2008 was the first full month of the recession. For each of the six recessions beginning with the short 1980 recession, the threshold is the average number of states that have negative growth in the state coincident index during the first month of the national recession.
Here are the number of states that had negative SCI growth at the start of these six recessions:
- February 1980: 30 states
- August 1981: 30 states
- August 1990: 26 states
- April 2001: 24 states
- January 2008: 9 states
- March 2020: 35 states
- Average: 26 states
The 2008 recession is clearly an outlier. The likely reason is that it was unclear at the time that the economy had entered a recession. In April 2008, the advance estimate showed that real GDP increased at a 3.2% annual rate in the first quarter of 2008. By the time of the third estimate, released in June 2008, first-quarter growth was revised up to 3.7%. Likewise, the advance estimate for second-quarter real GDP growth was 1.9%, which was subsequently revised to 2.8%. The current estimates that reflect all subsequent revisions of 2008 numbers show that real GDP declined at a 1.6% rate in the first quarter but increased at a 2.3% rate in the fourth quarter.
It was not until the failure of Lehman Brothers in September 2008, which triggered a sharp decline in equity prices and an economywide plunge in economic activity, that most economists viewed a recession as highly likely. By October 2008, 47 states registered negative SCI growth.
Is the U.S. Tipping into a Recession?
In sum, a threshold estimate based on this analysis shows that 26 states need to have negative growth in the SCI to have reasonable confidence that the national economy entered into a recession. Excluding the 2008 outlier raises the threshold to 29 states.
So, where are we now? In October 2022, 27 states had negative growth in the SCI. That would exceed the six-recession average of 26 states but would fall short of the outlier-adjusted estimate (excluding 2008) of 29. One caveat is worth noting: Populous states like California, Texas and Florida that have disproportionately large economies can sometimes exert a large influence on national economic activity. This analysis does not adjust for this fact.
Notes
- For example, see Michael T. Owyang, Jeremy M. Piger and Howard J. Wall’s 2005 article “Business Cycle Phases in U.S. States” in The Review of Economics and Statistics.
- The figure is not an original transformation of the data. Other economic analysts and economists have used versions of these data in a similar fashion.


Citation
Kevin L. Kliesen and Cassandra Marks, ldquoAre State Economic Conditions a Harbinger of a National Recession?,rdquo St. Louis Fed On the Economy, Dec. 28, 2022.
This blog offers commentary, analysis and data from our economists and experts. Views expressed are not necessarily those of the St. Louis Fed or Federal Reserve System.
Email Us
All other blog-related questions