


Market Liquidity and the Quantity Theory of Money
Inflation has been rising this year, with the latest consumer price index up 8.5% in July from a year earlier. Beginning in March 2022, the Federal Open Market Committee (FOMC) started a new tightening cycle—a period during which it increases the federal funds rate, which is the Fed’s policy rate.
So far, the fed funds rate target has increased by 225 basis points. What are the effects of the increase in the policy rate? In this blog post, we connect the deposits channel of monetary policyFor more on this theory, see the Itamar Drechsler, Alexi Savov and Philipp Schnabl’s 2017 article The Deposits Channel of Monetary Policy in The Quarterly Journal of Economics. with the quantity theory of money. The main idea is that because the fed funds rate is increasing, there is less liquidity in the market, and this might help to reduce the inflation rate in the months ahead.
The Quantity Theory of Money and Monetary Policy
The quantity theory of money is one of the basic theories taught in every intro economics course. The equation is this:
Mv = PQ
In this equation, M represents the amount of money in circulation, v is the velocity of money (the rate at which money is spent), P is the price level of goods, and Q is the quantity of goods sold. The velocity of money is usually assumed to be constant; thus, any changes in the money supply imply a change in the price or quantity of goods sold or both.
In practice, the difficulties of using monetary aggregates as a policy mechanism have been deregulation, financial innovation and other factors, resulting in instability in the relationships between monetary aggregates and other nominal variables, as then-Fed Chair Ben Bernanke noted in 2006. For this reason, the FOMC primarily seeks to use the federal funds rate, instead of monetary aggregate targets, as its monetary policy tool.
The Deposits Channel of Monetary Policy
The deposits channel of monetary policy argues that when the fed funds rate rises, deposit rates do not rise as much, so the opportunity cost of holding money and deposits increases, and deposits flow out of the banking system. Therefore, households and firms change their portfolios to hold fewer liquid assets when the fed funds rate increases.For a more in-depth discussion about the deposit channel of monetary policy, about why deposit spreads will increase and why money will move from deposits to more-illiquid assets, see our recent Economic Synopses essay, Liquidity Dries Up.
Consequently, while having the “correct” measure of monetary aggregates is hard in practice, we can look at the liquidity premium to evaluate the amount of liquidity in the market. To measure the liquidity premium, we compute the liquidity spread. This spread is the difference between the interest rate of two assets that have the same maturity and safety but differ in their liquidity.For more, see Arvind Krishnamurthy and Annette Vissing-Jorgensen’s 2012 article, and Stefan Nagel’s 2016 article. For the safe and liquid asset, we consider the three-month Treasury bill. For safe but illiquid assets, we consider both three-month commercial paper and three-month repurchase agreement (repo) rates.An upper bound for default on AA financial commercial paper over 1972-2017 was 1%, according to a Moody’s Investors Service report in 2018. Further, Stefan Nagel argues that repos backed by Treasury collateral are very safe. In this post, we looked at the Tullett Prebon repo, which is backed by general collateral and a mix of securities. We also considered the Refinitiv repo, which is backed by Treasuries. Hence, we can measure the liquidity spread with this equation:
Liquidity Spread = rilliquid – rliquid
If this liquidity spread is positive, then illiquid assets are paying higher rates to compensate for the lack of liquidity, and thus there is a liquidity premium. The figure below shows the short-term liquidity spread and the federal funds rate from January 2020 until June 2022.
Short-term Liquidity Spreads and the Federal Funds Rate
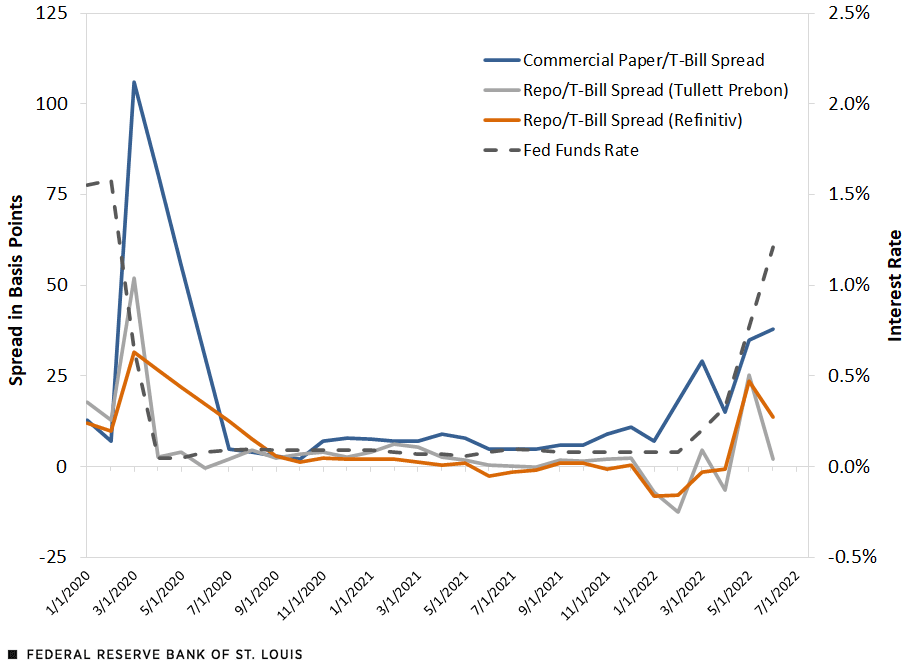
SOURCES: Board of Governors; Tullett Prebon and Refinitiv (retrieved from Haver Analytics); and authors’ calculations.
NOTES: Data are from January 2020 to June 2022. AA financial commercial paper, repurchase (repo) agreements and Treasury bills have three-month maturities.
At the start of COVID-19, we see a big jump in the liquidity spread, most of which is gone by July 2020. By July 2020, the FOMC had lowered the federal funds rate to near zero and had injected large amounts of liquidity into the market. Consequently, the market was flooded with liquidity, and the liquidity premium disappeared—the liquidity spread dropped to around zero. At the beginning of 2022, when the FOMC started raising the fed funds rate, we see a jump in short-term liquidity spreads, with the commercial paper spread up 50 basis points since the beginning of 2022.
In conclusion, the FOMC has begun a tightening cycle, and markets have started to price a positive liquidity premium. This is akin to reducing M in the quantity theory of money. Thus, the price or quantity of goods in the market, or both, should fall as well.
Notes
- For more on this theory, see the Itamar Drechsler, Alexi Savov and Philipp Schnabl’s 2017 article The Deposits Channel of Monetary Policy in The Quarterly Journal of Economics.
- For a more in-depth discussion about the deposit channel of monetary policy, about why deposit spreads will increase and why money will move from deposits to more-illiquid assets, see our recent Economic Synopses essay, Liquidity Dries Up.
- For more, see Arvind Krishnamurthy and Annette Vissing-Jorgensen’s 2012 article, and Stefan Nagel’s 2016 article.
- An upper bound for default on AA financial commercial paper over 1972-2017 was 1%, according to a Moody’s Investors Service report in 2018. Further, Stefan Nagel argues that repos backed by Treasury collateral are very safe. In this post, we looked at the Tullett Prebon repo, which is backed by general collateral and a mix of securities. We also considered the Refinitiv repo, which is backed by Treasuries.


Citation
Julian Kozlowski and Samuel Jordan-Wood, ldquoMarket Liquidity and the Quantity Theory of Money,rdquo St. Louis Fed On the Economy, Aug. 29, 2022.
This blog offers commentary, analysis and data from our economists and experts. Views expressed are not necessarily those of the St. Louis Fed or Federal Reserve System.
Email Us
All other blog-related questions