


Inflation and the Real Value of Debt: A Double-edged Sword
Partly because of the effects of the COVID-19 pandemic, inflation and record deficit spending have been in the news lately. And as the first figure shows, the U.S. debt-to-GDP ratio is at unprecedented levels and the U.S. inflation rate is higher than it has been in decades. This blog post explains the relation between nominal debt and inflation, using government debt as an example.This blog post talks about nominal debt, i.e., debt that is not linked to the price level. Only about 9% of U.S. debt was linked to the price level in 2019. Treasury bonds that are linked to the price level are called Treasury inflation-protected securities, or TIPS.
While a surprising burst of inflation immediately reduces the real value of a borrower’s debt burden—transferring wealth from lenders to borrowers—it is also likely to raise future borrowing costs because investors will then expect higher inflation and demand higher nominal yields on debt to compensate them for the expected loss of purchasing power and the associated uncertainty.
U.S. Debt-to-GDP, GDP Deflator Inflation and the 10-year Treasury Yield

SOURCE: FRED (Federal Reserve Economic Data).
NOTE: Annual data are from 1940 to 2021.
Inflation and the Real Value of Government Debt
A government’s nominal debt is the cumulated sum of past deficit spending. The primary deficit is the total deficit less interest payments. Debt is the cumulated sum of total deficits. The real value of government debt is its value in terms of a basket of goods and services; it is calculated by dividing the nominal debt value by the price level. Because a government’s ability to service debt is closely related to its tax base, which depends on the size of the national economy, economists often consider the ratio of government debt to gross domestic product (GDP). This also allows us to compare debt levels over time and across countries.
One can measure government debt in many ways. For example, gross debt only counts the debt that governments issue, while net debt deducts the value of assets that governments hold from gross debt. For the purposes of this blog post, we will use the annual FRED series for gross federal debt as a percentage of GDP. Using a different measure of debt would not change the basic argument. The discussion in this blog post applies generally to measures of nominal debt, not just this specific measure of government debt.
An increase in the price level directly reduces the real value of government debt, as well as the ratio of debt to GDP, because—holding other things constant—higher prices increase nominal GDP. Thus, surprise inflation transfers wealth from holders of U.S. government debt—who include both Americans and non-Americans—to U.S. taxpayers.Inflation transfers wealth from creditors to borrowers for all sorts of nominal debt, not just government debt. One should note that although inflation can benefit certain people at the expense of others, inflation is generally costly and even people who benefit in some ways will lose out in other ways. High and unpredictable inflation is much more costly than very low and stable inflation.
This transfer is not an unalloyed good even for U.S. taxpayers, however, because unexpected inflation will tend to raise the cost of servicing future U.S. debt—i.e., nominal yields—by increasing the expected rate of inflation and the risk premium associated with inflation. If the increase in nominal yields exceeds the increase in inflation, then the ex post real rate of interest—nominal yields adjusted for realized inflation—will go up and borrowers will have to repay more to lenders in terms of purchasing power.
Past Bouts of Inflation
The U.S. has previously experienced unexpectedly high inflation rates that reduced the real value of the national debt. Perhaps most notably, the U.S. ran very high inflation rates of 12.9% and 11% in 1946 and 1947, respectively, when the country was recovering from World War II and the government had recently removed wartime price controls. (See the yellow oval in the first figure.The first figure uses changes in the GDP deflator to measure inflation because it is most closely related to the effect of higher price levels on nominal GDP. Other measures of inflation, such as the changes in the consumer price index (CPI) or personal consumption expenditures (PCE) price index, will be closely correlated with the GDP deflator measure of inflation.) This inflationary burst helped reduce the U.S. debt-to-GDP ratio from 119% in 1946 to 92% in 1948.
Later, U.S. inflation rose more gradually, from 1.1% percent in 1963 to peaks of 9.3% in 1975 and 9.5% in 1981. (See the red arrow in first figure.) Market expectations only gradually adjusted to this rising inflation, however. That is, the yield on the 10-year Treasury just kept up with the GDP deflator inflation rate. Consequently, the ex-post real 10-year yield was negative for a time in the early 1970s, meaning that the government was borrowing long term at negative real rates that only slowly declined. (See the blue arrow in the second figure below.)
The 10-Year U.S. Treasury Yield and Its Ex-Post Real Yield
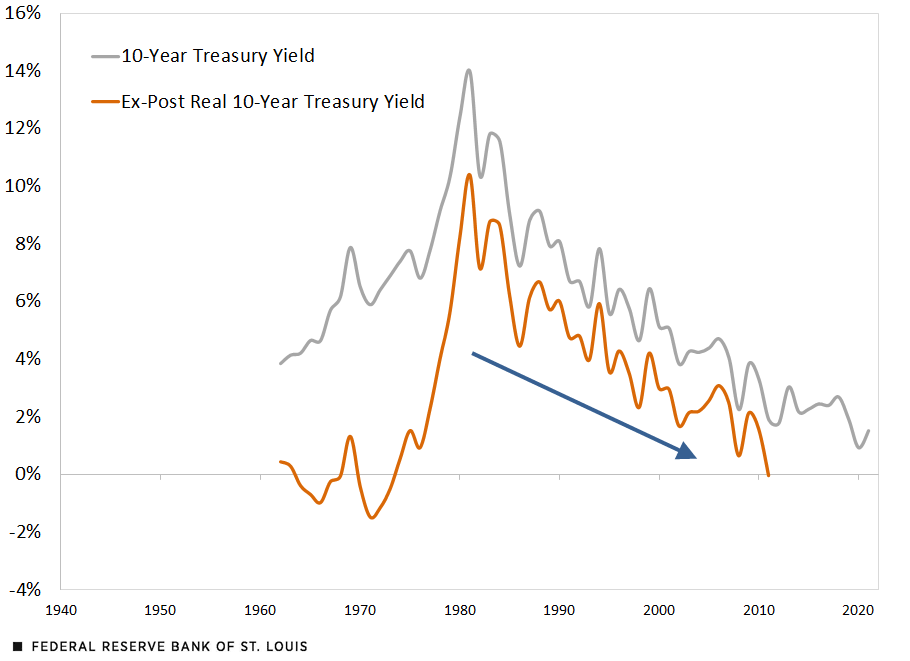
SOURCES: FRED (Federal Reserve Economic Data) and author’s calculations.
NOTES: The ex-post real 10-year Treasury yield is calculated by subtracting the forward-looking 10-year annualized rate of change of the GDP deflator from the 10-year yield at any given data point. Annual data for the nominal 10-year yield are from 1962 to 2021, while the data for the real yield are from 1962 to 2011.
Note that after the yield on the 10-year Treasury peaked in 1981, it declined only slowly until the mid-2000s, remaining well above the inflation rate. (See the blue arrow in the first figure.) The second figure shows a consequence of this pattern. The ex-post real yield for the 10-year Treasury—the difference between the 10-year yield and inflation over the life of the bond—rose dramatically in the late 1970s, peaking in 1981, and only slowly declined. These high real interest rates meant that the U.S. government had to borrow at high real interest rates for many years because the inflation of the 1960s and 1970s had raised inflation expectations and uncertainty about inflation, both of which increased the yields that investors would demand.
Possible Effects of Recent Inflation
In summary, the recent burst of inflation in the U.S. and the rest of the developed world will have two effects: It will immediately reduce the real value of existing debts, but it will also tend to raise expected inflation—and therefore yields—perhaps for years to come, which will increase the cost of borrowing in the future. The Federal Reserve’s credibility with the market will determine the extent to which the cost of borrowing increases and stays high. If markets believe that the Fed will quickly reduce inflation, then long rates will not rise too much and soon will return to levels consistent with the Fed’s inflation target of 2% in the personal consumption expenditures (PCE) price index.
Notes
1 This blog post talks about nominal debt, i.e., debt that is not linked to the price level. Only about 9% of U.S. debt was linked to the price level in 2019. Treasury bonds that are linked to the price level are called Treasury inflation-protected securities, or TIPS.
2 The primary deficit is the total deficit less interest payments. Debt is the cumulated sum of total deficits.
3 Inflation transfers wealth from creditors to borrowers for all sorts of nominal debt, not just government debt. One should note that although inflation can benefit certain people at the expense of others, inflation is generally costly and even people who benefit in some ways will lose out in other ways. High and unpredictable inflation is much more costly than very low and stable inflation.
4 The first figure uses changes in the GDP deflator to measure inflation because it is most closely related to the effect of higher price levels on nominal GDP. Other measures of inflation, such as the changes in the consumer price index (CPI) or personal consumption expenditures (PCE) price index, will be closely correlated with the GDP deflator measure of inflation.

Citation
Christopher J. Neely, ldquoInflation and the Real Value of Debt: A Double-edged Sword,rdquo St. Louis Fed On the Economy, Aug. 1, 2022.
This blog offers commentary, analysis and data from our economists and experts. Views expressed are not necessarily those of the St. Louis Fed or Federal Reserve System.
Email Us
All other blog-related questions