


The Pandemic’s Influence on U.S. Fertility Rates
After the general decline throughout the 20th century and the postwar baby boom/baby bust phenomenon, the U.S. total fertility rate (TFR) gradually increased from about 1.7 children per woman in 1975 to 2.1 in 2007. (See first figure below.) TFR measures the number of children that a woman is expected to have over her lifetime if she were to give birth to children in alignment with the prevailing age-specific birth rates. It is our preferred measure of childbearing choices as it is independent of the population age structure.One alternative measure of willingness to have children is the crude birth rate (CBR)—the number of births in a given year divided by population size and multiplied by 100. This measure is highly sensitive to the population age structure and gender composition. For example, CBR would be very high in a population with a lot of women in their late 20s and early 30s. TFR controls for the population age structure and gender composition—thus, it is the more appropriate concept to use if we are to discuss childbearing decisions.
Agewise, fertility rates increased the most for women in their 30s. Most importantly, the increase in fertility was driven mainly by higher educated women having more children. In a 2018 paper, Michael Bar, Moshe Hazan, Oksana Leukhina, David Weiss and Hosny Zoabi argued that this increase in fertility is closely associated with rising wage inequality. The idea is that, as wage inequality grows, the relative cost of the outsourcing of low-skilled tasks associated with child rearing (such as babysitting, cooking and housecleaning) declines the most for high-wage workers, allowing them to have more children without sacrificing time and careers.
This upward trend in fertility, however, has reverted since 2007, which marked the beginning of the Great Recession, as shown in the figure below. By 2020, the total fertility rate had dropped by almost 30%.
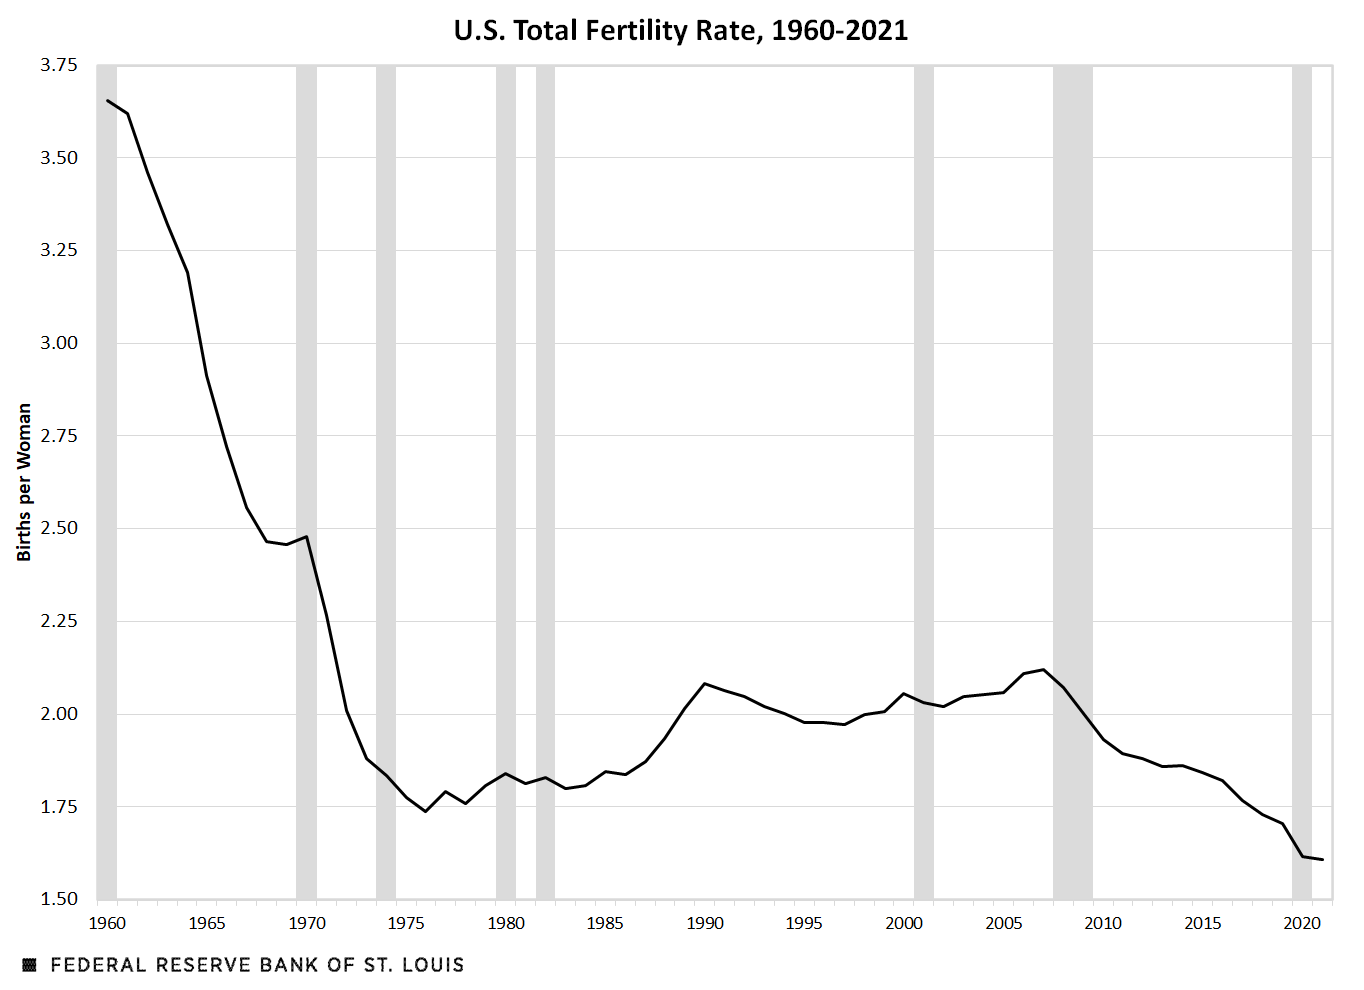
SOURCE: FRED.
NOTE: Shading marks the year that sustained the recent recession (2020) and previous years that recorded at least six months in recession.
We examine this recent fertility decline, highlighting changing fertility patterns by age group. We also highlight what happened during the pandemic, although these numbers are still preliminary.
Return to Declining Fertility
The post-Great Recession decline in the total fertility rate was driven by declining birth rates at earlier ages. The next figure plots age-specific birth rates for 2007 (which marks the most recent peak in fertility), as well as those for 2021 and a few years in between. We employ household-level data from the September supplement (the latest available) of the Current Population Survey. We estimate birth rates over the past year as the average number of own babies in the household for each female in a given age group.To the extent that not all babies live with their mothers, using CPS data understates official TFR. Infant mortality would also slightly bias our estimates down.
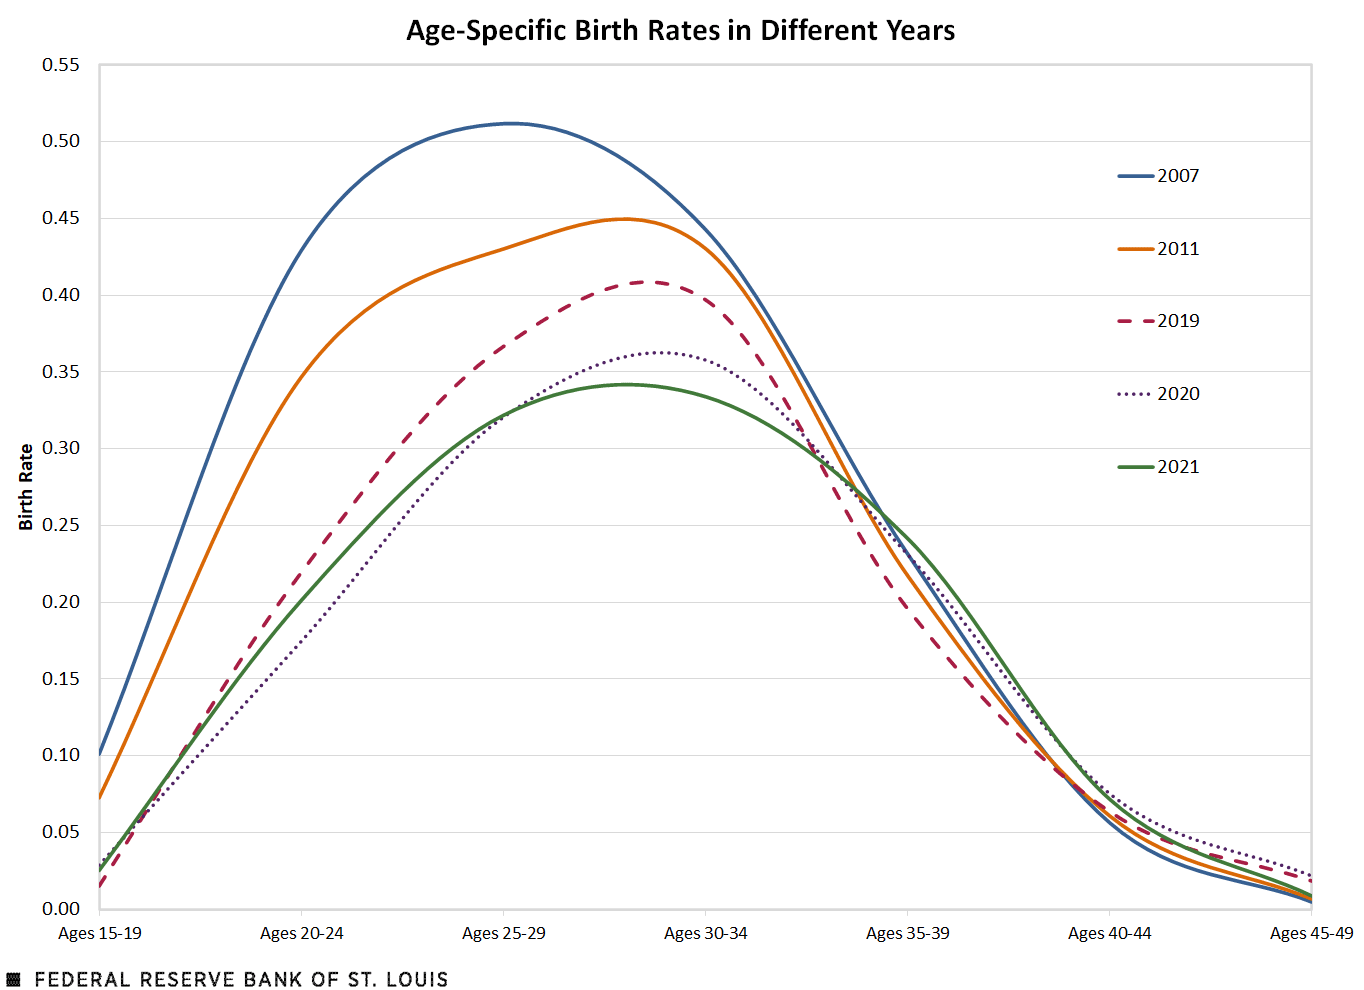
SOURCES: Current Population Survey and authors’ calculations.
NOTE: Data are for the September of the relevant year and have been smoothed in the figure.
Age-specific fertility rates, depicted in the figure, reflect age-specific birth rates as explained above. We see that, in 2007, birth rates peaked for the 25-29 age group. By 2020, fertility dropped the most for 15- to 19-year-old women, as well as for 20- to 24-year-old women and 25- to 29-year-old women. These fertility declines were 72%, 59% and 37%, respectively. As a result, birth rates now peak at ages 30-34. Fertility at older ages barely moved and even increased slightly, indicating that fertility did not simply decline but was also delayed to later ages. For example, birth rates of 40- to 44-year-old women increased by 33%.
Fertility Rates and the Pandemic
The impact of the pandemic on birth rates can be partially seen in our September 2021 estimates. The earliest effect on the decision to conceive a child would be seen in March 2020 and therefore would be reflected in birth rate data nine months later, i.e., December 2020. Our September 2021 fertility estimates are based on babies born between October 2020 and September 2021—babies born in 9 out of these 12 months would have been conceived during the pandemic. In other words, most of the changes we see between 2020 and 2021 are due to the pandemic. Therefore, it’s worth taking a closer look at 2020 and 2021 fertility estimates.
One year prior to the pandemic, TFR declined slightly between 2019 and 2020—see the red dashed line and the purple dotted line, respectively, in the second figure—dropping for younger women (continuing the overall trend) while increasing for women of ages 35-40 and older.
The negative impact of the pandemic is most apparent in the fertility of women of prime childbearing age—30- to 34-year-olds. These women were most likely to have young children at home and to have quit their jobs to support their children’s online schooling. Research shows that women have suffered disproportionately more during the pandemic recession, relative to other recessions, and their labor force participation rate has yet to return to its pre-pandemic level. The uncertainty regarding future economic growth associated with the arrival of the pandemic must have also contributed to the drop in fertility of these women.
Overall, TFR did not change much in the past year because the negative impact of the pandemic on women of prime childbearing age was offset by the increase in the birth rates for the 20- to 24-year-old women. It is possible that some of these younger women opted for earlier childbearing because the labor market did not look conducive to starting one’s career.
Notes and References
1 One alternative measure of willingness to have children is the crude birth rate (CBR)—the number of births in a given year divided by population size and multiplied by 100. This measure is highly sensitive to the population age structure and gender composition. For example, CBR would be very high in a population with a lot of women in their late 20s and early 30s. TFR controls for the population age structure and gender composition—thus, it is the more appropriate concept to use if we are to discuss childbearing decisions.
2 To the extent that not all babies live with their mothers, using CPS data understates official TFR. Infant mortality would also slightly bias our estimates down.


Citation
Oksana Leukhina and Amy Smaldone, ldquoThe Pandemic’s Influence on U.S. Fertility Rates,rdquo St. Louis Fed On the Economy, Nov. 4, 2021.
This blog offers commentary, analysis and data from our economists and experts. Views expressed are not necessarily those of the St. Louis Fed or Federal Reserve System.
Email Us
All other blog-related questions