How COVID-19 Affected Different Countries
Since the COVID-19 pandemic began in 2020, countries throughout the globe have suffered, but the effects have also been disparate. To gauge the pandemic’s effects in different parts of the world, a recent Regional Economist article classified 171 nations as having low, middle and high incomes, and used health statistics to determine how hard-hit they were.
In the article, Federal Reserve Bank of St. Louis economist and Assistant Vice President Juan M. Sánchez compared International Monetary Fund (IMF) forecasts from October 2019 (pre-pandemic) with 2020’s actual values to estimate the impact on gross domestic product (GDP) growth and economic policy variables.
Prior to the pandemic, low- and high-income groups each made up 25% of the world’s countries, and the middle-income group made up 50%, Sanchez wrote. The average income per capita in 2019 was more than five times larger in the middle-income group than in the low-income group. In the high-income group, it was almost 20 times larger.
Health and Policy Effects in Different Countries
The table below shows the health impact of the pandemic. Average excess mortality, or how much larger the number of deaths was relative to those in previous years, was more than 34% in low-income countries. In middle-income countries, it was almost 14%, and about 10% in high-income countries. Poorer countries also had much more limited COVID-19 testing because of fewer resources.
| Low-, Middle- and High-Income Countries | ||||
|---|---|---|---|---|
| Low Income | Middle Income | High Income | Total | |
| Average Excess Mortality in 2020 (%) | 34.40* | 13.80 | 9.94 | 11.37 |
| COVID-19 Tests Administered per Person (as of June 2021) | 0.04 | 0.26 | 1.09 | 0.34 |
| Cases Reported per 100 People (as of June 2021) | 0.18 | 2.58 | 6.95 | 1.82 |
| Fully Vaccinated per 100 People (as of June 2021) | 2.38 | 7.37 | 19.39 | 10.38 |
| SOURCES: Our World in Data, Penn World Table (version 10.0) and author’s calculations. | ||||
| NOTES: (*) The author has about 40, 80 and 40 countries in the low-, middle- and high-income country groups for most statistics. However, it is worth noting that only two countries had available data for excess mortality in the low-income group. | ||||
“Since the beginning of the pandemic, high-income countries did more than one test per person, while low-income countries did only one test per 27 people (or 0.037 per person),” Sánchez wrote. “Given the significant differences in testing, it is not surprising that reported cases were much higher in wealthier countries.”
By June 2021, almost 20% of the population in the wealthiest countries was fully vaccinated compared with about 2% in the poorest, he noted.
The Pandemic’s Effects on GDP Growth
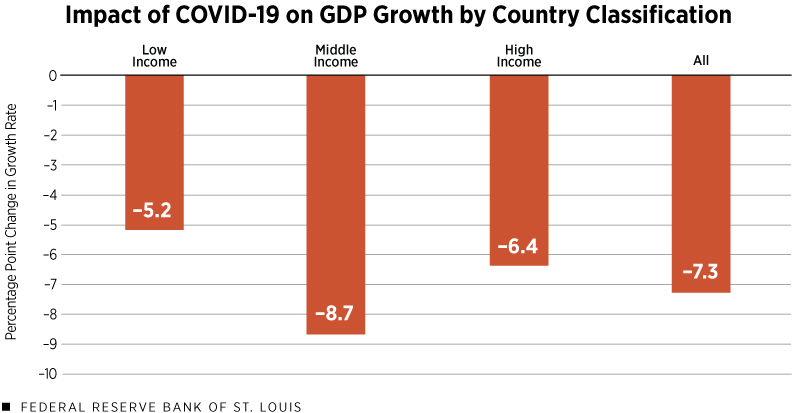
Widespread lockdowns had a direct impact on GDP. The figure below shows the difference between actual GDP growth in 2020 and the IMF’s 2020 forecast made in October 2019 for low-, middle- and high-income countries.

SOURCES: IMF World Economic Outlook Reports (April 2021 and October 2019), Penn World Table (version 10.0) and author’s calculations.
NOTE: The COVID-19 impact is the difference between the actual gross domestic product growth rate in 2020 and the IMF forecast for it made in October 2019.
In middle-income countries, median GDP growth declined by 8.7 percentage points, and wealthier countries lost 6.4 percentage points. The pandemic’s impact was smaller in poorer countries because many didn’t have the resources to implement strict lockdowns, Sánchez noted. But even in low-income countries, median GDP growth was 5.2 percentage points lower than expected.
The Economic Policy Angle
GDP growth wasn’t related only to lockdowns but also to economic policy responses in different nations. In the second table, the first three entries show the fiscal response to the pandemic as the difference between the actual value in 2020 and the IMF forecast in 2019.
| Low-, Middle- and High-Income Countries | ||||
|---|---|---|---|---|
| (Percentage Points) | ||||
| Low Income | Middle Income | High Income | All | |
| Change in Revenue/GDP | -0.78 | -1.14 | -0.76 | -0.91 |
| Change in Expenditure/GDP | 0.01 | 4.41 | 6.61 | 4.16 |
| Net government borrowing/GDP | 1.30 | 4.76 | 6.98 | 4.45 |
| Difference in M1 growth rate | 6.07 | 7.48 | 10.28 | 7.44 |
| Difference in M2 growth rate | 6.17 | 3.79 | 4.40 | 3.67 |
| Change in Inflation | 0.27 | -0.84 | -1.17 | -0.74 |
| SOURCES: IMF World Economic Outlook Reports (April 2021 and October 2019), Penn World Table (version 10.0), Haver Analytics and author’s calculations. | ||||
Revenue relative to GDP declined in all regions, but most significantly in middle-income countries. However, expenditures relative to GDP increased in middle- and high-income countries, while remaining stable in low-income countries.
COVID-19 also had a clear impact on monetary aggregates such as cash and deposits, represented by M1 and M2 in the table; he compared growth rates during COVID-19 with rates from 2017 to 2019. The pandemic indicates a rise in the growth rate of monetary aggregates for countries in all income groups, but more significantly in wealthier countries.
“Comparing actual outcomes with pre-pandemic forecasts, I found a significant impact of the pandemic on GDP growth, which is more prominent in middle-income countries,” the author wrote. “I conjecture that the impact on GDP growth was less significant in the poorest countries because of less restrictive lockdowns and in the wealthiest countries because of more aggressive economic policies.”
Citation
ldquoHow COVID-19 Affected Different Countries ,rdquo St. Louis Fed On the Economy, Nov. 29, 2021.
This blog offers commentary, analysis and data from our economists and experts. Views expressed are not necessarily those of the St. Louis Fed or Federal Reserve System.
Email Us
All other blog-related questions

