


The Comovement between Credit Spreads, Corporate Debt and Liquid Assets in Recent Crises
The U.S. economy suffered two very large and unusual crises over the past 20 years: the 2008 Great Financial Crisis (GFC) and the COVID‑19 crisis. Despite overall financial conditions being poor during both crises, there were major differences in how nonfinancial firms’ balance sheets responded.
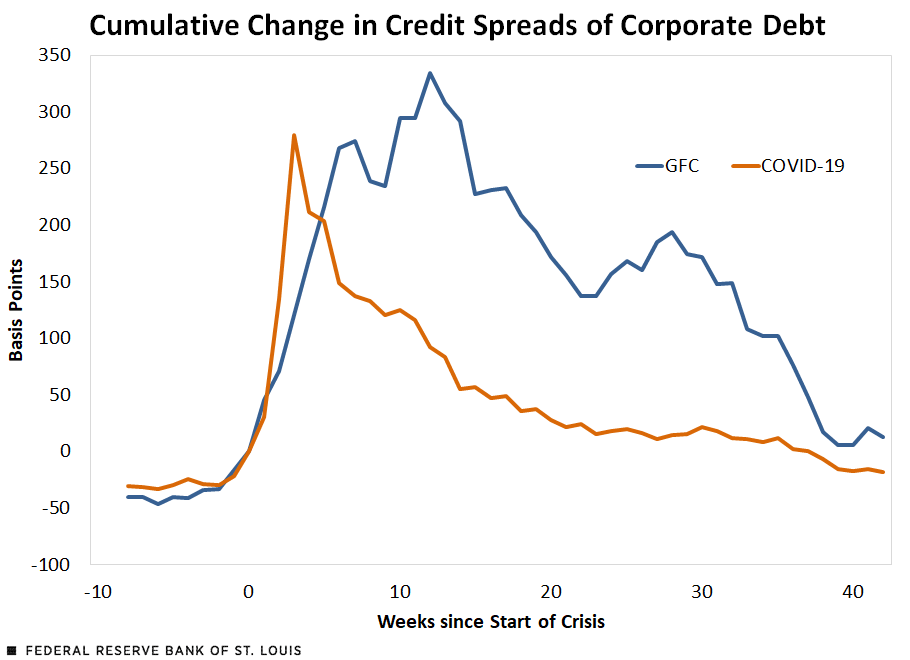
In this blog post, we examine the cost of borrowing by looking at the evolution of credit spreads during each of the crises. The first figure shows the change in credit spreads since the beginning of each crisis. We use the change in credit spreads so the two events are comparable despite differences in the magnitude of the credit spreads.
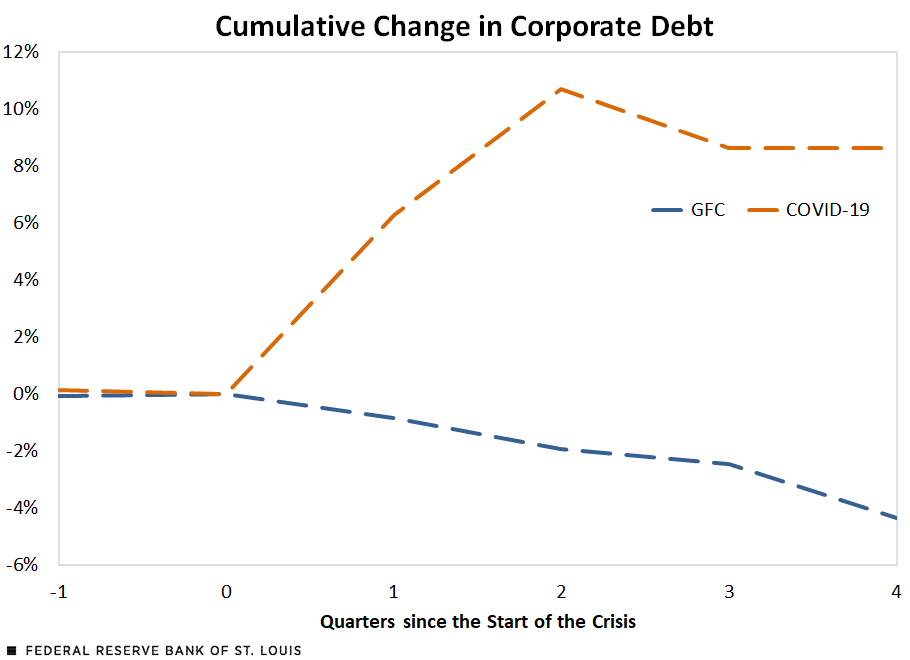
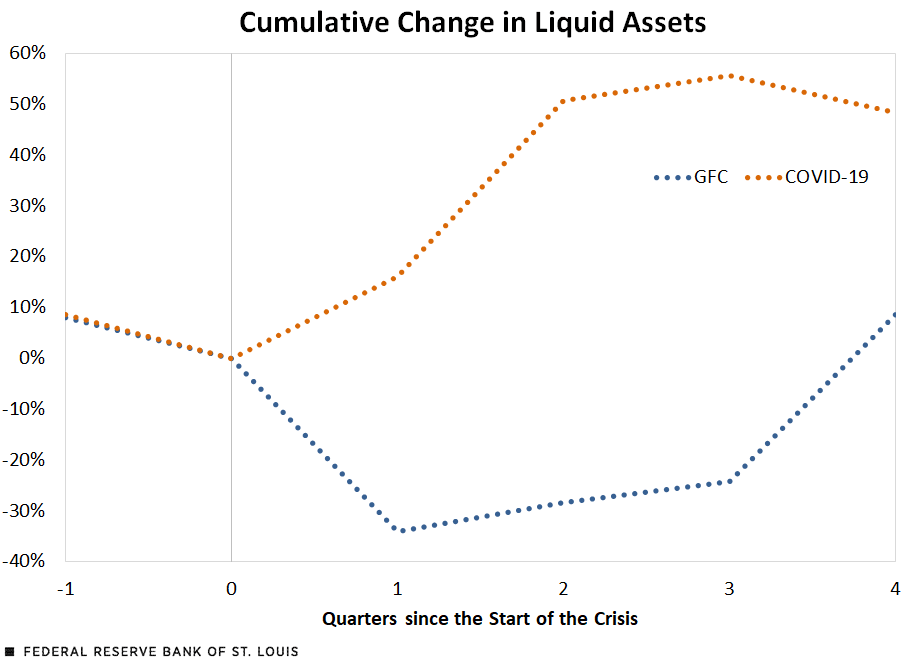
We define the start of the GFC as the bankruptcy of Lehman Brothers on Sept. 15, 2008. Similarly, we define the beginning of the COVID‑19 crisis as Feb. 28, 2020—the date when financial market volatility began rising. The second figure shows U.S. nonfinancial corporations’ corporate debt, and the third figure displays liquid assets that nonfinancial corporations hold. Those two figures show the quarterly paths of real debt and liquid assets as percentage changes from their values at the onset of each of the crises (the third quarter of 2008 for the GFC and the fourth quarter of 2019 for COVID‑19).We start with data taken from the Financial Accounts of the United States (from the Board of Governors of the Federal Reserve System) and FRED (from the St. Louis Fed). Debt is constructed as the sum of debt securities (FL104122005 in the Financial Accounts) and loans(FL104123005); liquid assets are equal to checkable deposits and currency (FL103020000). Both series are deflated using the gross domestic product implicit price deflator (GDPDEF on FRED). We look at quarters since the beginning of each crisis as opposed to weeks because firm financial data are available only at quarterly frequency.
Comovement during the Great Financial Crisis
During the GFC, we observe a negative comovement between (1) credit spreads and (2) debt and liquid assets. The cost of borrowing increased—credit spreads increased nearly 300 basis points early in the crisis. Spreads dropped 150 basis points in the middle of the crisis, but then rose again before gradually declining back to pre-GFC norms after about 40 weeks.
Debt, however, trended consistently downward for all four quarters after the start of the crisis, ending with nonfinancial corporations having about 4% less debt in the third quarter of 2009 than in the third quarter of 2008. Liquid asset holdings sharply declined in the first quarter after the start of the GFC, falling 34%. During the following two quarters, liquid assets slowly trended upward but remained 24% to 28% below the level in the third quarter of 2008.
Comovement during the COVID-19 Crisis
During COVID-19, however, we observe a positive comovement between (1) credit spreads and (2) debt and liquid assets. Credit spreads once again rose to around 300 basis points early in the crisis, before slowly, but consistently, dropping to precrisis levels. Nonfinancial corporations’ debt increased by more than 10% in the first two quarters. Four quarters after the crisis started, debt remained more than 8% above where it began. Similarly, liquid asset holdings rose nearly 50% in the first two quarters following the start of the COVID‑19 crisis.
SOURCES FOR THE THREE FIGURES: Financial Accounts of the United States, FRED and authors’ calculations.
NOTES FOR THE THREE FIGURES: Data are for nonfinancial corporations. Start of the Great Financial Crisis is Lehman Brothers’ bankruptcy on Sept. 15, 2008, and start of the COVID-19 crisis is Feb. 28, 2020.
Liquidity Shock Can Explain the Difference
So why did comovement differ during these two crises? In a recent working paper by Mahdi Ebsim, Miguel Faria-e-Castro and Julian Kozlowski, the authors show that one key difference between the GFC and COVID‑19 was the presence of a liquidity crisis with trade credit and supply chain disruptions during the pandemic.See David Baqaee and Emmanuel Farhi’s February 2021 working paper, “ Supply and Demand in Disaggregated Keynesian Economies with an Application to the COVID‑19 Crisis (PDF),” and Frédéric Boissay, Nikhil Patel and Hyun Song Shin’s June 2020 article, “Trade Credit, Trade Finance, and the COVID‑19 Crisis." These types of disturbances were not present during the GFC, at least for nonfinancial firms. In the working paper, the authors argue that this liquidity shock can explain the observed opposite comovement between (1) credit spreads and (2) debt and liquid assets during the GFC and COVID‑19.
Notes and References
1 We start with data taken from the Financial Accounts of the United States (from the Board of Governors of the Federal Reserve System) and FRED (from the St. Louis Fed). Debt is constructed as the sum of debt securities (FL104122005 in the Financial Accounts) and loans(FL104123005); liquid assets are equal to checkable deposits and currency (FL103020000). Both series are deflated using the gross domestic product implicit price deflator (GDPDEF on FRED). We look at quarters since the beginning of each crisis as opposed to weeks because firm financial data are available only at quarterly frequency.
2 See David Baqaee and Emmanuel Farhi’s February 2021 working paper, “ Supply and Demand in Disaggregated Keynesian Economies with an Application to the COVID‑19 Crisis (PDF),” and Frédéric Boissay, Nikhil Patel and Hyun Song Shin’s June 2020 article, “Trade Credit, Trade Finance, and the COVID‑19 Crisis."


Citation
Julian Kozlowski, Miguel Faria-e-Castro and Samuel Jordan-Wood, ldquoThe Comovement between Credit Spreads, Corporate Debt and Liquid Assets in Recent Crises,rdquo St. Louis Fed On the Economy, Nov. 9, 2021.
This blog offers commentary, analysis and data from our economists and experts. Views expressed are not necessarily those of the St. Louis Fed or Federal Reserve System.
Email Us
All other blog-related questions