


Marshall Plan May Not Have Been Key to Europe’s Reconstruction
On the morning of May 9, 1945, Europe awoke at peace but also in financial ruins. Per-capita gross domestic product (GDP) had fallen to 30% of U.S. per-capita GDP in 1945 from 63% in 1933.
World War II decimated Western Europe’s economy. To finance the reconstruction of Europe, an American initiative called the Marshall Plan was instituted, and the International Bank for Reconstruction and Development (IBRD)—now known as the World Bank—was created.
With all the region’s financing needs, one would have expected to see negative net capital flows into Europe. In other words, Europe should have attracted net capital inflows, and that should have been reflected in negative trade balances as the continent imported manufactured goods that were needed for reconstruction. However, this was not the case.
The figure below plots net exports as a percentage of GDP from 1950-70 for the U.S. and two aggregates: EuropeEurope includes the following countries: Austria, Belgium, Denmark, France, Germany, Greece, Italy, Luxembourg, Netherlands, Norway, Portugal, Sweden, Switzerland, Turkey and the United Kingdom. and the rest of the world.The rest of the world includes the following countries: Argentina, Australia, Brazil, Canada, Chile, Colombia, Hong Kong, Iceland, Japan, Mexico, New Zealand, Peru, Singapore, South Korea and Taiwan. We see that Europe’s net trade flows were mostly flat through the 1950s and 1960s. Furthermore, Europe’s average imports to GDP from 1950-60 were about 10%, which is relatively small compared with future decades. In addition, we found that U.S. goods exports to Europe declined from 1947 to 1950 and then remained flat thereafter.Authors’ calculations from U.S. Census Bureau data.
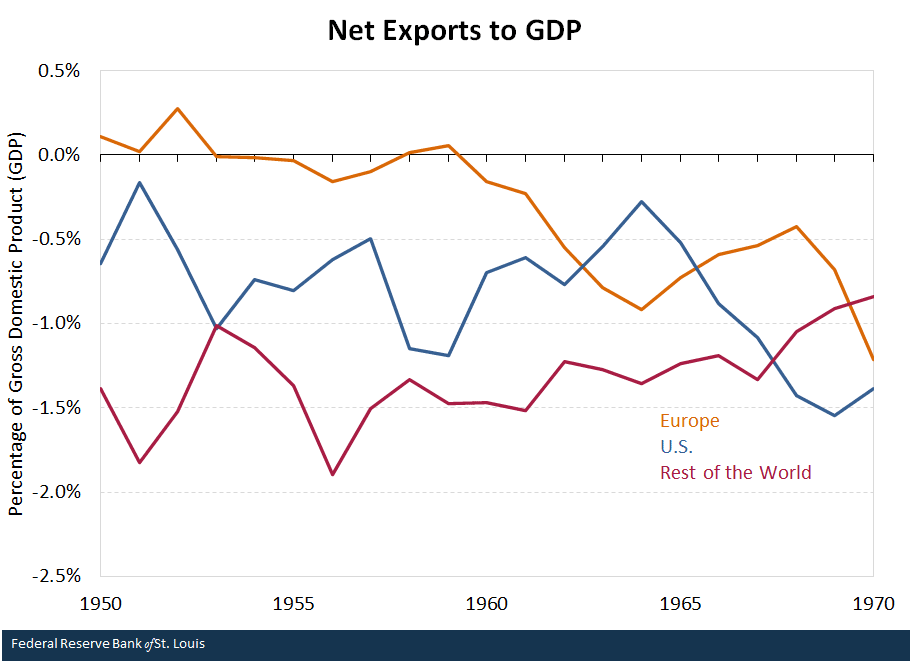
SOURCES: Organization for Economic Cooperation and Development, the World Bank, the Groningen Growth and Development Center, the National Bureau of Statistics of China and authors’ calculations.
NOTES: Europe includes the following countries: Austria, Belgium, Denmark, France, Germany, Greece, Italy, Luxembourg, the Netherlands, Norway, Portugal, Sweden, Switzerland, Turkey and the United Kingdom. The rest of the world includes the following countries: Argentina, Australia, Brazil, Canada, Chile, Colombia, Hong Kong, Iceland, Japan, Mexico, New Zealand, Peru, Singapore, South Korea and Taiwan.
Capital and Imports
This lack of net capital inflows into Europe is surprising. First, given the war’s destruction to Europe’s manufacturing base, we would have expected Europe to import large amounts of manufacturing goods primarily from the U.S., since the region likely would not have been able to manufacture enough goods needed to meet the demands of reconstruction. Second, the aid pledged to Europe in the Marshall Plan—about $13 billion, or $138 billion in 2019 dollars—combined with the financing from the IBRD would have left Europe with sufficient funding for these manufactured goods. The results would be high imports and trade deficits. But net capital flows were not negative during the 10 years following the end of the war.
Together this suggests that the Marshall Plan and IBRD lending played a smaller role in European reconstruction than what has been commonly believed. Instead, Europe was primarily responsible for rebuilding its own economy.
The figure below shows the amount of aid each country received from the Marshall Plan in 2019 dollars. The United Kingdom and France received the most at $33 billion and $28 billion, respectively. However, these amounts represent no more than 5% of the gross national product of each recipient nation.See Tarnoff, Curt. “The Marshall Plan: Design, Accomplishments, and Significance.” Congressional Research Services, Jan. 18, 2018.
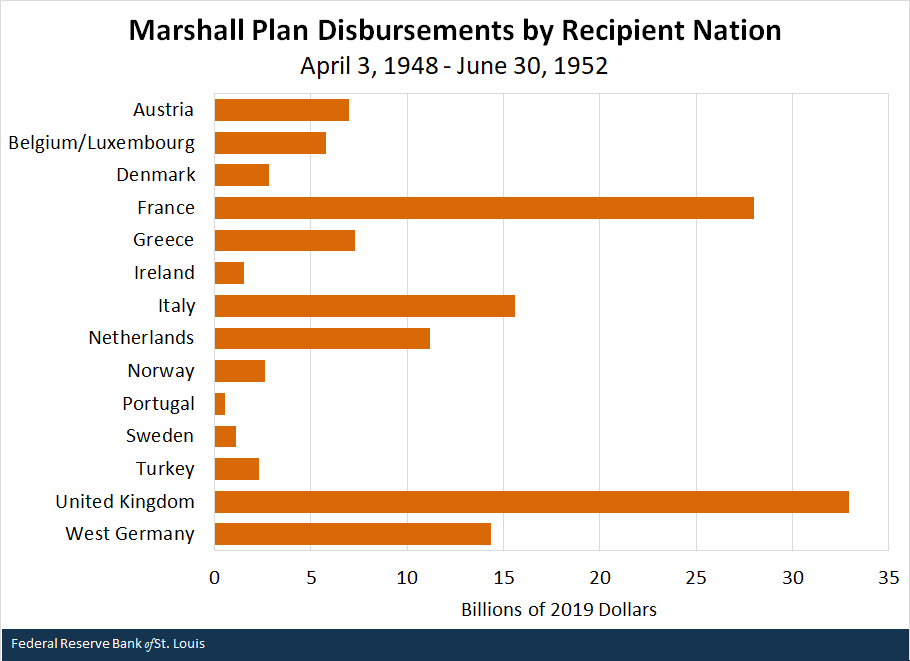
SOURCES: Tarnoff, 2018; Bureau of Labor Statistics; and authors’ calculations.
NOTE: We exclude countries that do not belong to our “Europe” aggregate; the excluded amount is less than $5 billion in 2019 dollars.
Role of IBRD
IBRD lending also supplemented European reconstruction, and the following figures show IBRD disbursements to Europe from 1947-60 by year and by country, respectively.
IBRD lending had a much more limited scope—it only funded specific, approved projects—and total IBRD lending to these countries during this period amounted to only about $12 billion in 2019 dollars, which pales in comparison to the Marshall Plan.
The bulk of lending occurred in 1947, with over $5 billion in 2019 dollars, and each following year generally saw less than $1 billion in lending, as show in the figure below.
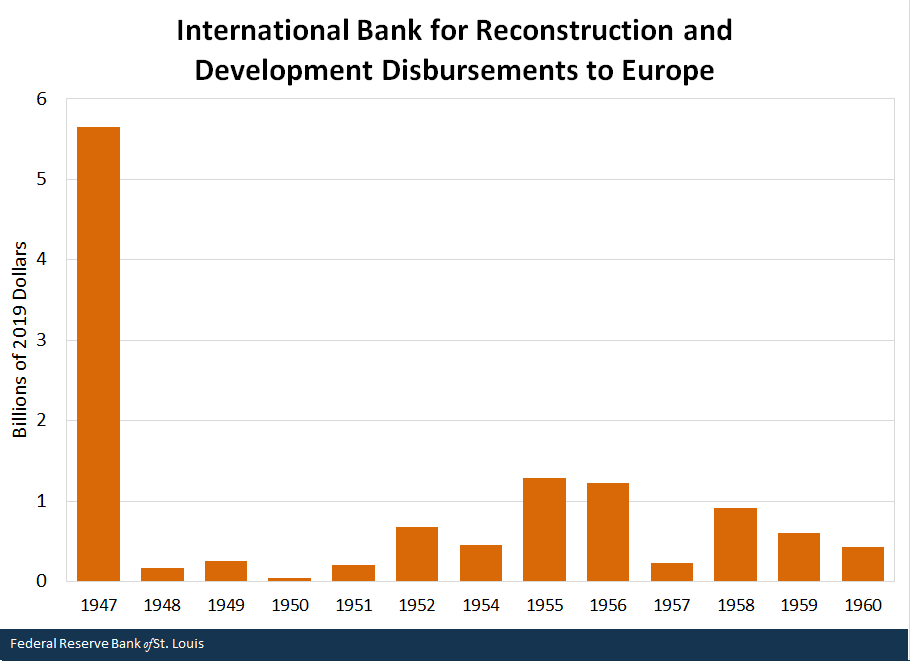
SOURCES: The World Bank IBRD-IDA, Bureau of Labor Statistics and authors’ calculations.
In the next figure, we see that France, Italy and the Netherlands were the largest funding recipients, but the U.K. and Germany did not receive any help from the IBRD.
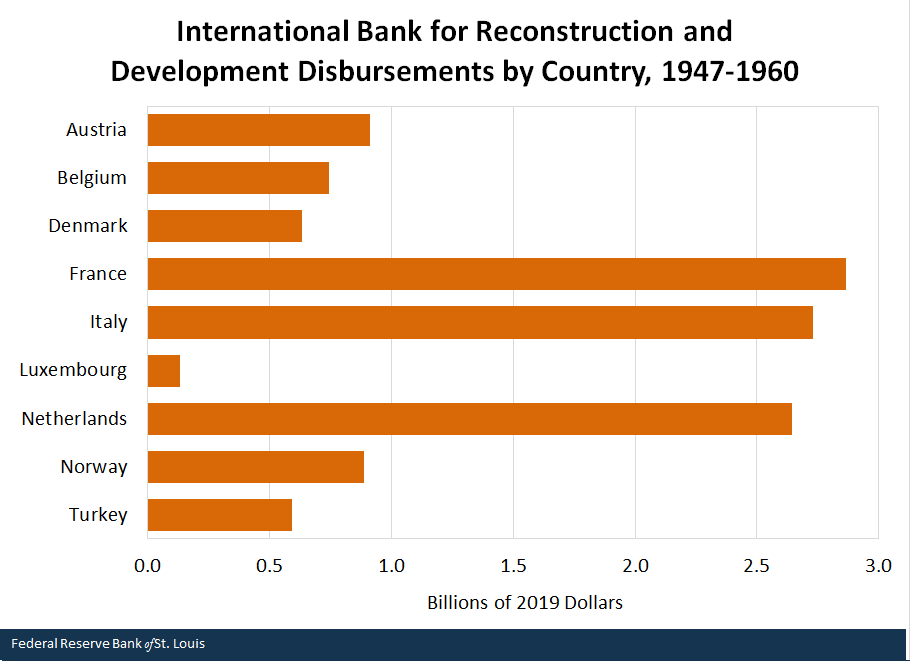
SOURCES: The World Bank IBRD-IDA, Bureau of Labor Statistics and authors’ calculations.
Europe Rebuilt Itself
Ultimately, net capital did not flow into Europe during this time despite international financing to support European reconstruction. This surprising result suggests that Europe itself was primarily responsible for its own reconstruction, and that the Marshall Plan and IBRD loans may have played a much smaller role in aiding European reconstruction than previously thought.
Notes and References
- Europe includes the following countries: Austria, Belgium, Denmark, France, Germany, Greece, Italy, Luxembourg, Netherlands, Norway, Portugal, Sweden, Switzerland, Turkey and the United Kingdom.
- The rest of the world includes the following countries: Argentina, Australia, Brazil, Canada, Chile, Colombia, Hong Kong, Iceland, Japan, Mexico, New Zealand, Peru, Singapore, South Korea and Taiwan.
- Authors’ calculations from U.S. Census Bureau data.
- See Tarnoff, Curt. “The Marshall Plan: Design, Accomplishments, and Significance.” Congressional Research Services, Jan. 18, 2018.
Additional Resources
- Timely Topics: A New Look at the Bretton Woods Agreement
- Econ Ed: The Arsenal of Democracy: The United States in World War II
- On the Economy: The COVID-19 Recession in Historical Perspective


Citation
Paulina Restrepo-Echavarría and Brian Reinbold, ldquoMarshall Plan May Not Have Been Key to Europe’s Reconstruction,rdquo St. Louis Fed On the Economy, July 1, 2021.
This blog offers commentary, analysis and data from our economists and experts. Views expressed are not necessarily those of the St. Louis Fed or Federal Reserve System.
Email Us
All other blog-related questions