


Older Workers Accounted for All Net Employment Growth in Past 20 Years
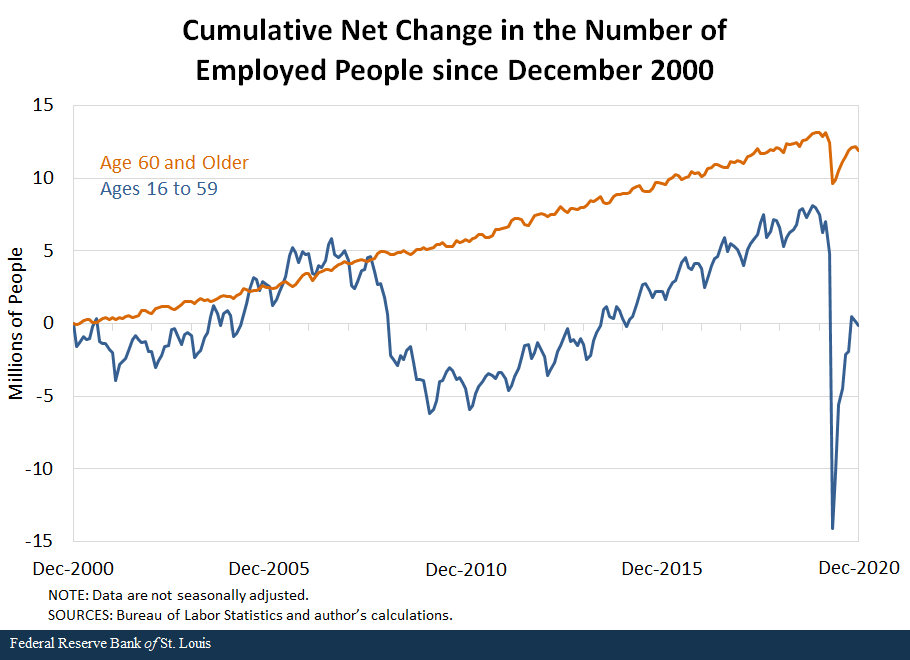
Total U.S. employment grew by 11,767,000, or 8.5%, in the 20 years ending in December 2020.All data cited in this article are from the Household Survey in the monthly Employment Situation Report published by the Bureau of Labor Statistics. I accessed the not seasonally adjusted data via Haver Analytics. All that growth—11,879,000, or 101% of the total—was due to increased employment of people age 60 and older. Meanwhile, the net employment change over the past two decades of people ages 16-59 was -112,000 (-1% of the total change), despite this younger group being 3.8 times as large as the older group in December 2000 and still 2.4 times as large in December 2020. (See the figure below.)
What’s Driving This Outcome
This age-skewed labor-market outcome was the result of two differences between the groups:
- The older population (60 and older) grew much faster than the younger population (16-59).
- The employment-to-population (E-P) ratio among those 60 and older increased significantly while the E-P ratio among the younger population declined, on balance.
With the exception of the large decline in the E-P ratio of the younger population, which is difficult to predict in the years ahead, the basic trend of rising employment among older workers is likely to continue for some time for the following reasons:
- The older population is likely to continue growing faster than the younger group.The Census Bureau projects significantly faster growth in the 60 and older population than in the 16-59 age group in every decade through 2060, the last year of the projections. For the entire 2020-60 period, the older age group is projected to increase by 53% and the younger group by 13%.
- The E-P ratio of the 60 and older group is likely to increase further as the health and educational attainment of older people continues to improve and the demand for older workers persists.For an extensive discussion of factors driving changes in the E-P ratio for various groups, see Abraham, Katharine G.; and Kearney, Melissa S. “Explaining the Decline in the U.S. Employment-to-Population Ratio: A Review of the Evidence.” Journal of Economic Literature, September 2020, Vol. 58, No. 3, pp. 585-643.
Sources of Employment Growth
By definition, the level of employment of any group at a point in time is the product of its population size and its E-P ratio:
Employment = Population × (Employment-to-Population Ratio)
The change in employment over time is the result of changes in these two factors:
Employment Change = (Population Change) × (E-P Ratio Change)
= [(Population Change) x (Beginning E-P Ratio)] + [(Ending Population) x (E-P Ratio Change)]
We can interpret this formula as the sum of the extensive margin of change—i.e., population changes—and the intensive margin of change—E-P ratio changes. The levels and changes in each of these quantities between December 2000 and December 2020 for the two groups discussed here are in the table below.
| Ages 16-59 | Age 60 and Older | Total, Age 16 and Older | |
|---|---|---|---|
| Population | |||
| December 2000 | 169,286,000 | 44,450,000 | 213,736,000 |
| December 2020 | 184,806,000 | 76,424,000 | 261,230,000 |
| Change, 2000 to 2020 | 15,520,000 | 31,974,000 | 47,494,000 |
| Percent Change, 2000 to 2020 | 9.2% | 71.9% | 22.2% |
| Employment-to-Population Ratio | |||
| December 2000 | 75.9% | 20.9% | 64.5% |
| December 2020 | 69.5% | 27.7% | 57.3% |
| Change, 2000 to 2020 | -6.4 percentage points | 6.8 percentage points | -7.2 percentage points |
| Total Employment | |||
| December 2000 | 128,549,000 | 9,297,000 | 137,846,000 |
| December 2020 | 128,437,000 | 21,176,000 | 149,613,000 |
| Change, 2000 to 2020 | -112,000 | 11,879,000 | 11,767,000 |
| Percent Change, 2000 to 2020 | -0.1% | 127.8% | 8.5% |
| NOTE: Data are not seasonally adjusted. | |||
| SOURCES: Bureau of Labor Statistics and author’s calculations. | |||
Population
The first key difference between the two age groups between 2000 and 2020 was population growth. While both groups became larger, the 60 and older age group increased by about 32 million, or 72%, while the 16-59 age group increased by about 15.5 million, or 9%. This difference alone would have translated into a larger share of employment gains among the older group even if E-P ratios had not changed for either group.
Employment-to-Population Ratios
The second important difference between the two groups was a decline of 6.4 percentage points in the E-P ratio of the 16-59 age group, while the E-P ratio increased by 6.8 percentage points among the 60 and older age group. This difference alone would have resulted in faster employment growth and a larger share of total employment gains for the older group even if the populations of the respective groups had changed at the same rate.Note that the two-decade change in the E-P ratio for all ages, 16 and older (-7.2 percentage points in the first table) is not a simple weighted average of the ratio changes for the two groups.
Employment
As a result of faster population growth in the older group and a narrowing of the difference between the E-P ratios of the two age groups, the older group experienced vastly more employment growth than the younger group. Employment increased by 11,879,000 (127.8%) among people age 60 and older but declined by 112,000 (-0.1%) among people ages 16-59.
Contributions of Population Growth and E-P Ratio Shifts to Employment Growth
It’s possible to quantify the relative contributions of population growth and changes in employment rates to the differing employment growth experiences by age group.
- I define the extensive margin of change as the change in employment due solely to a change in the number of people in an age group, holding constant the E-P ratio at the start of the period of comparison.
- I define the intensive margin of change as the change in employment due solely to a change in the share of people in an age group who are working, holding constant the number of people in each group at the end of the period of comparison.
The breakdowns of total employment change into extensive and intensive margins of change are shown in the table below.
| Ages 16-59 | Age 60 and Older | |
|---|---|---|
| Extensive Margin of Change | ||
| 20-Year Change in Population | 15,520,000 | 31,974,000 |
| E-P Ratio, December 2000 | 75.9% | 20.9% |
| Implied 20-year Employment Change (Change in population multiplied by the beginning E-P ratio) |
11,785,266 | 6,687,565 |
| Intensive Margin of Change | ||
| 20-Year Change in E-P Ratio | -6.4 percentage points | 6.8 percentage points |
| Population, December 2020 | 184,806,000 | 76,424,000 |
| Implied 20-Year Employment Change (Change in E-P ratio multiplied by the ending population) |
-11,897,266 | 5,191,435 |
| Total Employment Change | ||
| Actual 20-Year Change (Sum of extensive- and intensive-margin changes) |
-112,000 | 11,879,000 |
| NOTE: Data are not seasonally adjusted. | ||
| SOURCES: Bureau of Labor Statistics and author’s calculations. | ||
For 16- to 59-year-olds, 20-year employment changes due to extensive- and intensive-margin contributions are almost exactly offsetting. Employment in this group would have increased by 11.8 million because of population growth if the E-P ratio had not changed, while employment would have decreased by 11.9 million because of a decline in the E-P ratio alone.
For those 60 and older, employment increased along both margins. Population growth alone would have contributed 6.7 million to employment growth even if the E-P ratio had not changed. In addition, the group’s increased E-P ratio itself would have resulted in an employment increase of 5.2 million.
Workforce Likely to Continue Aging
The aging of the population and diverging employment rates across age groups together resulted in a sharp skewing of employment growth toward older workers during the last two decades. Continued population aging is almost certain, and signs point toward further increases in the E-P ratio among older adults. The greatest source of uncertainty about the age composition of the future workforce is the direction of change of the E-P ratio among working-age people under 60.
Notes and References
- All data cited in this article are from the Household Survey in the monthly Employment Situation Report published by the Bureau of Labor Statistics. I accessed the not seasonally adjusted data via Haver Analytics.
- The Census Bureau projects significantly faster growth in the 60 and older population than in the 16-59 age group in every decade through 2060, the last year of the projections. For the entire 2020-60 period, the older age group is projected to increase by 53% and the younger group by 13%.
- For an extensive discussion of factors driving changes in the E-P ratio for various groups, see Abraham, Katharine G.; and Kearney, Melissa S. “Explaining the Decline in the U.S. Employment-to-Population Ratio: A Review of the Evidence.” Journal of Economic Literature, September 2020, Vol. 58, No. 3, pp. 585-643.
- Note that the two-decade change in the E-P ratio for all ages, 16 and older (-7.2 percentage points in the first table) is not a simple weighted average of the ratio changes for the two groups.
Additional Resources
- On the Economy: U.S. Population Growth Slowed Further in 2020
- On the Economy: Employment Losses in Contact-Intensive Industries

Citation
William R. Emmons, ldquoOlder Workers Accounted for All Net Employment Growth in Past 20 Years,rdquo St. Louis Fed On the Economy, Feb. 1, 2021.
This blog offers commentary, analysis and data from our economists and experts. Views expressed are not necessarily those of the St. Louis Fed or Federal Reserve System.
Email Us
All other blog-related questions