A Pre-Omicron Look at Leisure and Hospitality Employment
The leisure and hospitality sector was significantly affected by COVID-19-related shutdowns in spring 2020. In an Oct. 4 Regional Economist article, St. Louis Fed Senior Economist Charles S. Gascon, Associate Economist Nathan Jefferson and Research Associate Devin Werner examined employment in this sector before the pandemic, the decline in the early months of the pandemic and the recovery as of July 2021. They compared data across the Eighth Federal Reserve District and data for the U.S. as a whole.The Eighth District includes all of Arkansas, southern Illinois, southern Indiana, western Kentucky, eastern Missouri, northern Mississippi and western Tennessee.
How the Eighth District Compared to the Nation
Pre-Pandemic
Before the pandemic, the leisure and hospitality sector comprised a slightly smaller share of the Eighth District’s economy than the U.S. average, the authors noted.
- Around February 2020, the sector’s jobs in the District accounted for 10.7% of total employment, 4.3% of quarterly wages and 3% to 5% of total output, measured by gross domestic product (GDP), they pointed out.
- In comparison, the sector’s jobs in the U.S. accounted for 11.1% of total employment, 5.8% of quarterly wages and 3.8% of total output, as shown in the table.
| U.S., Eighth District and District MSAs | ||||||
| U.S. | Eighth District | St. Louis MSA | Louisville MSA | Memphis MSA | Little Rock MSA | |
|---|---|---|---|---|---|---|
| % Nonfarm Employment | 11.1% | 10.7% | 10.9% | 10.5% | 10.3% | 9.6% |
| % Quarterly Wages, 2019:Q4 | 5.8% | 4.3% | 4.3% | 4.3% | 4.7% | 3.7% |
| U.S. and Eighth District States | |||||||
| U.S. | Arkansas | Indiana | Kentucky | Mississippi | Missouri | Tennessee | |
|---|---|---|---|---|---|---|---|
| % Real GDP, 2019:Q4 | 3.8% | 3.1% | 3.4% | 3.3% | 4.1% | 3.9% | 5.4% |
| SOURCES FOR BOTH TABLES: Haver Analytics and the Bureau of Labor Statistics. | |||||||
| NOTES FOR BOTH TABLES: GDP and non-national wage series are quarterly; values for the fourth quarter of 2019 are shown. Also shown are state-level GDP data for District states instead of calculating the District’s GDP exactly, since that would require county-level GDP data, which are only available annually. We exclude Illinois because about 90% of the state’s economic output is from the Chicago MSA, which is outside the Eighth District. We focus on February 2020 data when possible because it was the last month that would have been unaffected by the widespread mid-March shutdowns. | |||||||
“The fact that this industry makes up a disproportionate fraction of employment compared with wages and output makes intuitive sense, since leisure and hospitality is a labor-intensive and relatively low-wage sector,” the authors wrote.
“As a result, the economic shock to the leisure and hospitality sector resulted in significant job losses but had less of an impact on overall output than shocks to sectors like manufacturing or construction, which are capital intensive and can spill over to many other sectors,” they explained.
The leisure and hospitality sector’s size and activity throughout the District vary considerably, the authors noted. For example, they pointed out that in tourism-heavy counties near the Ozarks and Arkansas’ Hot Springs, the sector’s share of wages and employees is three to four times higher than the national average. “The increased importance of the sector to output means that downturns are felt acutely in these regions,” wrote Gascon, Jefferson and Werner.
The Pandemic’s Impact and the Region’s Recovery
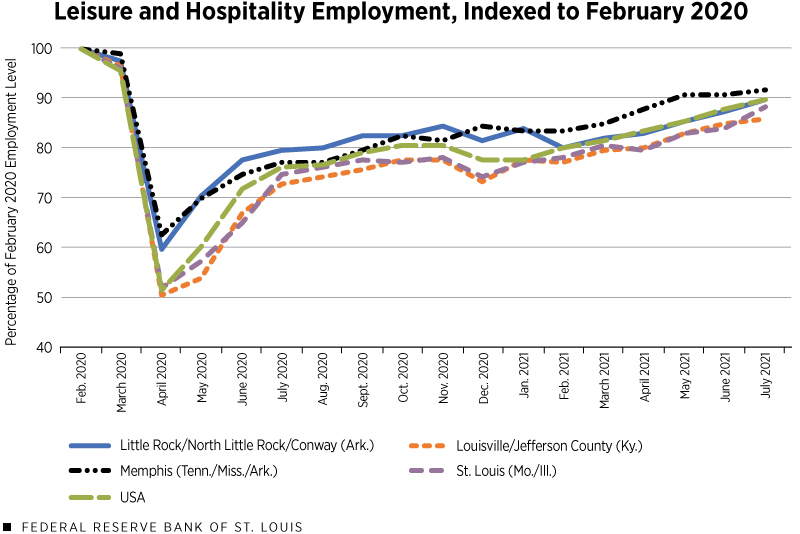
Job losses in the leisure and hospitality sector surged across the U.S. early in the pandemic. The authors cited New York state, which saw a 62% decline in its number of leisure and hospitality employees from April 2019 to April 2020. The authors also noted that every state in the Eighth District saw a decrease in that sector’s employment of at least 35% in April 2020.

SOURCES: Haver Analytics, the Bureau of Labor Statistics and authors’ calculations.
NOTE: Total leisure and hospitality employment by region are calculated as a fraction of the employment level in February 2020.
“While the District’s leisure and hospitality sector suffered significant employment declines during the pandemic, the overall magnitude of the fall was lower than national averages,” the authors wrote. Specifically, they noted that the Louisville and St. Louis metropolitan statistical areas (MSAs) had declines similar to the national average, while Little Rock and Memphis fared better, as shown in the figure.
As the District’s economy improved, the MSAs with the largest declines improved more quickly because of the amount of slack in their economies, the authors noted. Consequently, the leisure and hospitality sector in all major District MSAs had converged to an employment rate close to the national average as of July 2021 data. The authors noted that most District MSAs had leisure and hospitality employment levels in July 2021 that were about 90% of their pre-pandemic levels.
Notes and References
- The Eighth District includes all of Arkansas, southern Illinois, southern Indiana, western Kentucky, eastern Missouri, northern Mississippi and western Tennessee.
Citation
ldquoA Pre-Omicron Look at Leisure and Hospitality Employment ,rdquo St. Louis Fed On the Economy, Dec. 30, 2021.
This blog offers commentary, analysis and data from our economists and experts. Views expressed are not necessarily those of the St. Louis Fed or Federal Reserve System.
Email Us
All other blog-related questions

