


Leisure and Hospitality Sector’s Recovery Complicated by Delta Variant
KEY TAKEAWAYS
- COVID-19-related shutdowns in spring 2020 affected the leisure and hospitality sector most, although conditions improved quickly.
- A year later, vaccines, federal aid and improved consumer confidence have boosted the sector in the Fed’s Eighth District and beyond.
- As the fall begins and concerns over the delta variant linger, complications could arise for the sector’s continued recovery.

The economic shutdowns caused by the COVID-19 pandemic in spring 2020 primarily impacted the leisure and hospitality sector. The leisure and hospitality supersector consists of the arts, entertainment and recreation sector and the accommodation and food services sector. See Industries at a Glance: Leisure and Hospitality (bls.gov). Travel restrictions cut down on the visitors who power the industry, and social-distancing mandates limited capacity at venues that remained open. By one measure, many leisure and hospitality jobs are among the most high-contact occupations; this left the sector’s employees particularly vulnerable to job losses and at risk of contracting COVID-19.
The result was a surge in job losses across the nation as these businesses temporarily closed their doors. For example, New York state saw its number of leisure and hospitality employees fall a staggering 62% from April 2019 to April 2020.
While the Eighth District’s employment decline in the sector wasn’t the worst in the nation, every state in the DistrictThe Eighth District includes all of Arkansas, southern Illinois, southern Indiana, western Kentucky, eastern Missouri, northern Mississippi and western Tennessee. experienced decreases of at least 35% in April 2020 alone. However, economic conditions improved quickly after that initial shock, and by July 2020 Illinois was the only Eighth District state with year-over-year employment declines in the sector greater than 20%.
A year later, the availability of vaccines, federal aid and improved consumer confidence have provided the sector with a much-needed boost. July 2021 leisure and hospitality employment was up at least 12% in all District states relative to the same period one year ago. Still, a significant shortfall remains. When compared with pre-pandemic employment levels, all District states have leisure and hospitality employment below their 2019 levels, which suggests that there is still space for additional hiring as economic conditions improve.
Sector Employment in the District vs. Nationwide
To better understand where the leisure and hospitality sector stands, this article examines employment data across the District using metropolitan statistical areas (MSAs) and statewide data. By learning where sector employment fell, where it’s returning and how these data compare to national trends, we can glean valuable information about what changes to expect in the coming months.
| U.S., Eighth District and District MSAs | ||||||
| U.S. | Eighth District | St. Louis MSA | Louisville MSA | Memphis MSA | Little Rock MSA | |
|---|---|---|---|---|---|---|
| % Nonfarm Employment | 11.1% | 10.7% | 10.9% | 10.5% | 10.3% | 9.6% |
| % Quarterly Wages, 2019:Q4 | 5.8% | 4.3% | 4.3% | 4.3% | 4.7% | 3.7% |
| U.S. and Eighth District States | |||||||
| U.S. | Arkansas | Indiana | Kentucky | Mississippi | Missouri | Tennessee | |
|---|---|---|---|---|---|---|---|
| % Real GDP, 2019:Q4 | 3.8% | 3.1% | 3.4% | 3.3% | 4.1% | 3.9% | 5.4% |
| SOURCES FOR BOTH TABLES: Haver Analytics and the Bureau of Labor Statistics. | |||||||
| NOTES FOR BOTH TABLES: GDP and non-national wage series are quarterly; values for the fourth quarter of 2019 are shown. Also shown are state-level GDP data for District states instead of calculating the District’s GDP exactly, since that would require county-level GDP data, which are only available annually. We exclude Illinois because about 90% of the state’s economic output is from the Chicago MSA, which is outside the Eighth District. We focus on February 2020 data when possible because it was the last month that would have been unaffected by the widespread mid-March shutdowns. | |||||||
Prior to the pandemic, the Eighth District’s leisure and hospitality sector composed a slightly smaller share of the economy than the U.S. average. Around February 2020 (the last full month before the effects of the pandemic), leisure and hospitality jobs in the District made up 10.7% of total employment, 4.3% of quarterly wages and 3% to 5% of total output, measured by GDP. The fact that this industry makes up a disproportionate fraction of employment compared with wages and output makes intuitive sense, since leisure and hospitality is a labor-intensive and relatively low-wage sector.
As a result, the economic shock to the leisure and hospitality sector resulted in significant job losses but had less of an impact on overall output than shocks to sectors like manufacturing or construction, which are capital intensive and can spill over to many other sectors. This helps explain why the recovery from the pandemic has seen GDP growth return to pre-pandemic trends while labor market recovery lags.
There are also significant disparities in leisure and hospitality sector size and activity across geographic regions in the District. Within the Eighth District’s tourism-heavy counties near the Ozarks and Arkansas’ Hot Springs, the leisure and hospitality sector’s share of wages and employees is three to four times higher than the national average. Taney County, Mo., for example, had 39.7% of all employed people working in the leisure and hospitality sector in December 2019, accounting for 30.6% of wages.This information was calculated using raw data from the Bureau of Labor Statistics. The increased importance of the sector to output means that downturns are felt acutely in these regions.
The Pandemic’s Impact and the Region’s Recovery
While the District’s leisure and hospitality sector suffered significant employment declines during the pandemic, the overall magnitude of the fall was lower than national averages; notably, while the Louisville and St. Louis MSAs experienced declines similar to the national average, Little Rock and Memphis fared better.
The recent recovery, however, has put all four MSAs and the national average in a similar situation. As conditions have improved across the District, the MSAs that saw the largest declines have been able to improve faster because of the amount of slack in their economies; as a result, all major MSAs have converged to an employment rate close to the national average.
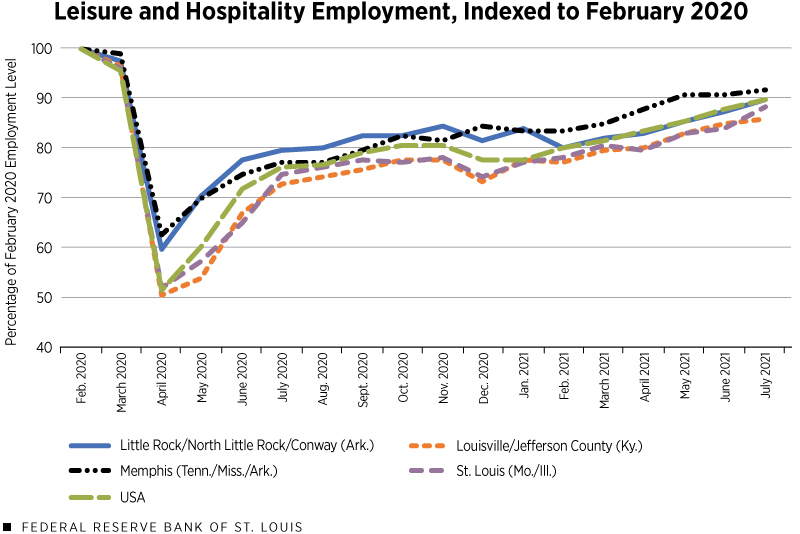
SOURCES: Haver Analytics, the Bureau of Labor Statistics and authors’ calculations.
NOTE: Total leisure and hospitality employment by region are calculated as a fraction of the employment level in February 2020.
Employment growth in leisure and hospitality rose sharply as pandemic restrictions were lifted and COVID-19 hospitalizations declined. By early 2021, however, the recovery had begun to wane in many parts of the District as hospitalization rates increased and workers remained at home, with vaccines still on the horizon. The spring 2021 employment gains resumed, and most District MSAs are now about 90% of the way back to pre-pandemic levels of leisure and hospitality employment.
While these figures have been rising steadily since the first few months of 2021, the pace at which they are increasing suggests that a return to pre-pandemic employment levels remains several months away. The slow return has been attributed to many factors: continued fear of COVID-19 exposure, family and child care responsibilities and expanded federal payments, to name a few. Faced with these challenges, many firms report significantly increasing wages and providing incentives to attract workers, particularly to meet seasonal demand.
Consumer Sentiment Improving, but Delta Variant Poses Risks
Leisure spending data for the summer months aren’t available yet, but there are indications that demand was strengthening during that period. The Conference Board’s bimonthly consumer confidence survey found that vacation intention expectations had rebounded modestly through the summer. See the figure below.
June 2021 saw 37.9% of survey respondents planning to take a vacation within the next six months, up 12% from the previous year (33.8%) but down 27% from June 2019 (51.7%). August saw an even stronger rebound, with 41.1% of respondents planning a vacation—up 16% from 2020 (35.3%) and down 24% from 2019 (54.3%).
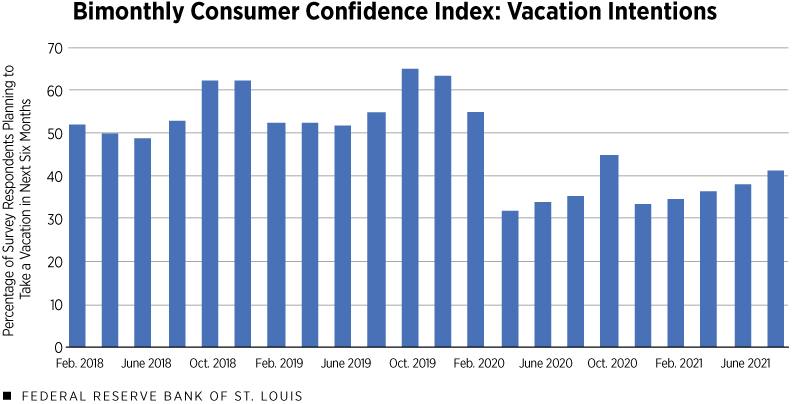
SOURCE: Haver Analytics and The Conference Board.
In contrast, plane travel expectations didn’t respond as quickly to the pandemic but have been slower to return to pre-pandemic levels. This effect is explained by the difference between business and leisure travel: Because tourism is generally planned well in advance, people still expected to take future vacations in the initial stages of the pandemic. The share of respondents expecting to travel by plane reached a low of 12.4% in August 2020 and had only risen to 20.6% by August 2021, down 32% from August 2019.
Relative shifts in vacation expectations using different modes of travel this summer reflected continued COVID-19 concerns and international uncertainty, both of which could have proven helpful to the District’s leisure sector. Vehicle travel expectations were faster to recover after the pandemic than plane travel; only 15% of survey respondents intended auto vacations in April 2020, but by October 2020, 35.9% of respondents did—the highest rate in over a decade. By August 2021, auto vacation expectations had fallen to 28.1% of respondents—5% less than in August 2020, but still above historical levels for this time of year.
While these indicators suggest strengthening demand, the rise of the delta variant threatens to put a damper on the leisure and hospitality sector’s hopes for continued recovery. Measures of national consumer sentiment, which had shown rapid improvement after the winter months, saw slower growth in the spring and then significant decreases in late summer as cases started to pick back up.
The University of Michigan’s Index of Consumer Sentiment, for example, reached a pandemic-era high of 88.3 in April before falling to 70.3 in July and 78.2 in August, an even lower level than in April 2020. On the employment front, August 2021 saw a net loss in food services and drinking places of employment nationwide and a net zero change in leisure and hospitality employment overall—a sharp contrast after average national job gains of 350,000 per month over the previous six months.
While these measures do not necessarily indicate an impending sharp decline in economic activity, they reflect that consumer expectations remain highly sensitive to changes in pandemic circumstances, even after the arrival of vaccines.
Since the health of the District’s leisure and hospitality sector is linked to consumer confidence and consumers’ ability to go out in public safely, it is one of the sectors most vulnerable to these expectations. The challenge for the winter months lies in restoring public confidence and giving the industry the demand it needs to continue a steady recovery.
- The leisure and hospitality supersector consists of the arts, entertainment and recreation sector and the accommodation and food services sector. See Industries at a Glance: Leisure and Hospitality (bls.gov).
- The Eighth District includes all of Arkansas, southern Illinois, southern Indiana, western Kentucky, eastern Missouri, northern Mississippi and western Tennessee.
- This information was calculated using raw data from the Bureau of Labor Statistics.


Views expressed in Regional Economist are not necessarily those of the St. Louis Fed or Federal Reserve System.
For the latest insights from our economists and other St. Louis Fed experts, visit On the Economy and subscribe.
Email Us