Are State Political Leanings and Government Spending Correlated?

The Texas Capitol in Austin, photographed at night.
In recent decades, political divisions have intensified in the U.S.See the Pew Research Center’s 2014 article “Political Polarization in the American Public.” Republicans and Democrats appear to disagree on a multitude of issues, including the size and allocation of government expenditures.See the Pew Research Center’s 2019 article “Little Public Support for Reductions in Federal Spending.”
Considering these disagreements, we might expect to see strong correlations between state political leanings and state and local government expenditure patterns. In this post, we investigate whether we actually observe such correlations in the data.
Data on Political Leanings and Government Spending
To produce these correlations, we used the following data:
State Political Leanings
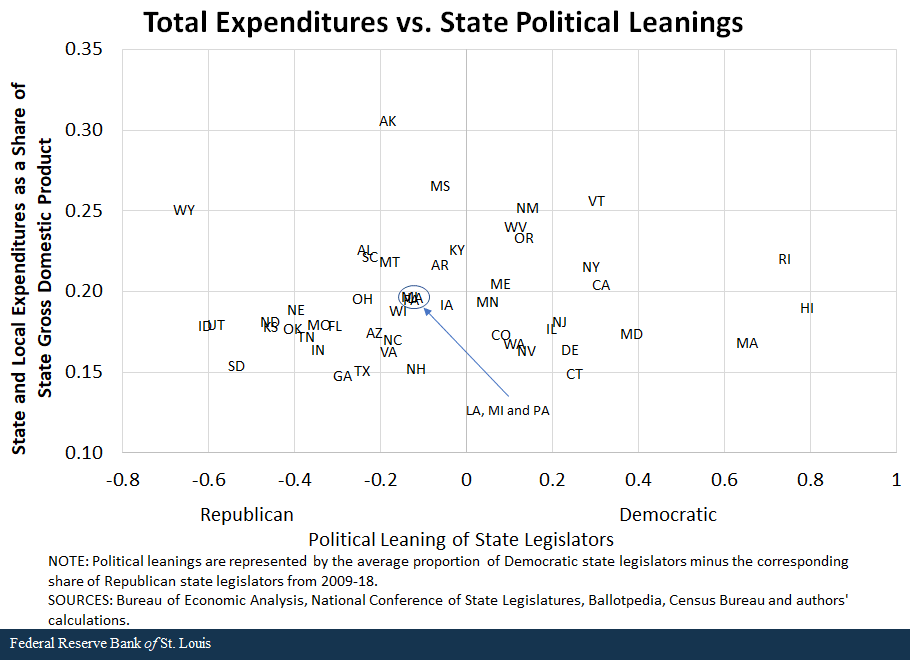
We used the average proportion of Democratic state legislators minus the corresponding share of Republican state legislators from 2009-18.Most of these data are from the National Conference of State Legislatures. The one exception is Nebraska. Nebraska has a unicameral state legislature, consisting of just a state senate, and its legislators have no official party affiliations. Therefore, we use Ballotpedia’s evaluation of Nebraska state legislator party affiliation from 2014-18 (all data available) to calculate the measure for Nebraska. The resulting measurement of state political leanings can then range from -1 (100% Republican leaning) to +1 (100% Democratic leaning), with an increase in the index reflecting a stronger Democratic influence in a state’s legislature. We used an average of proportions over the decade, because public finance policy typically evolves over time.
State and Local Government Expenditures
These data, for 2018, are from the Annual Survey of State and Local Government Finances conducted by the Census Bureau. We looked at total expenditures as well as the main expenditure categories:
- Education
- Social Security and Income Maintenance
- Transportation
- Public Safety
- Environment and HousingFor more information regarding the Census’ classification of government expenditures, see its Classification Manual (PDF).
A correlation coefficient measures the strength of the linear relationship between two variables. The metric ranges from -1 to 1:
- A measure of -1 indicates a perfect negative relationship. In this case, the more Republican-leaning the state is, the more it spends on a given category.
- A measure of +1 indicates a perfect positive relationship. In this case, the more Democratic-leaning a state is, the more it spends on a given category.
- The value 0 indicates no relationship. Typically, a correlation coefficient of magnitude 0.7 or higher is considered a strong correlation.
The Correlation between Politics and Government Spending
When we evaluate state-level government expenditures (which includes local spending), we cannot just compare nominal dollar amounts across states, as states vary dramatically in population. For example, far more people live in New York than in Alabama, therefore New York will inevitably spend more to provide services for its entire population. One way to account for this would be to measure government expenditures per person (or per capita).
As reported in the table below, we observe weak-to-moderate correlations between state political leanings and per capita state government expenditures. This most notably indicates that states leaning more Democratic tend to spend more per capita on public safety, on social security and income maintenance, and in total.Similar results hold if real expenditures per capita—adjusted for cost of living across states using regional price parities from the Bureau of Economic Analysis—are used instead.
The Politics of Spending
| Correlation between Expenditures per Capita and Political Leaning | Correlation between Expenditures as a Share of State GDP and Political Leaning | |
|---|---|---|
| Total Expenditures | 0.31 | 0.10 |
| Education | 0.20 | -0.05 |
| Social Security and Income Maintenance | 0.32 | 0.10 |
| Transportation | -0.11 | -0.22 |
| Public Safety | 0.35 | 0.16 |
| Environment and Housing | 0.22 | 0.07 |
| SOURCES: Bureau of Economic Analysis, National Conference of State Legislatures, Ballotpedia, Census Bureau and authors’ calculations. | ||
Controlling for State Incomes
However, states also have varied incomes. States with higher incomes have a higher tax base from which to collect tax revenue, and higher tax revenue results in a larger budget for state expenditures. Higher state incomes are driven not only by the population size of the state but also the types of jobs/industries prevalent within the state: States with higher paying jobs and more profitable industries will naturally have higher personal income.
Blue states tend to have higher per capita income, which could therefore drive the correlations we see in the first column of data in the table. To control for both population and income, we can measure state government expenditures as a ratio of state GDP in 2018,Similar results hold if gross state income (GSI) is used instead of state GDP. the typical measure used in the literature to compare government expenditures across entities.
The second column of data in the table shows correlations between state political leanings and state government expenditures as a ratio of GDP. When we measure expenditures in the preferred way, the correlations diminish in magnitude across the board (save for the transportation category).
Hence, when we appropriately control for both varied population and income across states, we see no obvious relationship between state-level political leanings and government expenditures. The figure below shows this lack of relationship between political leanings and total expenditures as a ratio of state-level GDP across states.

These results are not to say that political leanings and state government expenditures are definitively unrelated; rather, they indicate that political leanings and state government expenditures are not as closely related on the surface as we might expect given political rhetoric. It may be that expenditures on the state-level reflect the fixed costs of providing services to state constituents, and political divisions arise more when determining federal government contributions to services.
More nuanced empirical research is required to ascertain the true causal relationship (or lack thereof) between state political leanings and state government expenditures, with controls for other state-level legislature dynamics (e.g. whether the executive branch and legislative branch are controlled by same political party or governing is politically divided) as well as factors other than political leanings (e.g. economic conditions, demographics).
Notes and References
- See the Pew Research Center’s 2014 article “Political Polarization in the American Public.”
- See the Pew Research Center’s 2019 article “Little Public Support for Reductions in Federal Spending.”
- Most of these data are from the National Conference of State Legislatures. The one exception is Nebraska. Nebraska has a unicameral state legislature, consisting of just a state senate, and its legislators have no official party affiliations. Therefore, we use Ballotpedia’s evaluation of Nebraska state legislator party affiliation from 2014-18 (all data available) to calculate the measure for Nebraska.
- For more information regarding the Census’ classification of government expenditures, see its Classification Manual (PDF).
- Similar results hold if real expenditures per capita—adjusted for cost of living across states using regional price parities from the Bureau of Economic Analysis—are used instead.
- Similar results hold if gross state income (GSI) is used instead of state GDP.
Additional Resources
- On the Economy: Does Government Spending Stimulate the Economy?
- On the Economy: Do Red and Blue States Differ on Government Finances?
- On the Economy: How Does Government Spending Affect Inflation?
Citation
YiLi Chien, ldquoAre State Political Leanings and Government Spending Correlated?,rdquo St. Louis Fed On the Economy, April 19, 2021.
This blog offers commentary, analysis and data from our economists and experts. Views expressed are not necessarily those of the St. Louis Fed or Federal Reserve System.
Email Us
All other blog-related questions


