Do Red and Blue States Differ on Government Finances?

Conservatives traditionally favor smaller government and lower taxes, while liberals favor a larger, more active government. Yet “red” states don’t appear to have relatively smaller government budgets than “blue” states, according to a recent Economic Synopses essay.
Senior Economist YiLi Chien and Senior Research Associate Paul Morris looked at whether a state’s political leaning influences its state and local government revenues and expenditures. To gauge each state’s public finances, the authors calculated the state and local government revenues and spending as a percentage of state-level gross domestic product (GDP).
Two red states showed the extremes of both revenues and expenditures. In 2014, the size of state and local revenue relative to state-level GDP ranged from 12.6 percent in Texas to 24.5 percent in Alaska. For spending, the level ranged from 12.2 percent in Texas to 25 percent in Alaska.
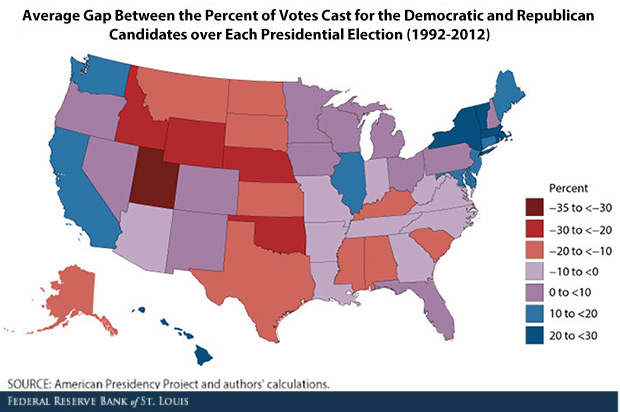
The authors then measured the political leaning of each state by examining the results of presidential elections from 1992 to 2012. They measured the average gap between the percent of votes cast for the Democratic and Republican candidates.

“We chose this measure of states' political leanings because people often associate red (conservative) and blue (liberal) states with presidential election results,” they wrote.
Chien and Morris plotted out each state’s spending and revenue percentages in comparison to the presidential voting gap, and found that “the results exhibit no discernible patterns, in contrast with the traditionally held perception.”
They calculated the correlation coefficients between these variables, and found that the correlation between state and local government revenues and expenditures relative to state-level GDP and the average election results were 0.02 and 0.04, respectively.1
In other words, “we find little evidence that state and local government revenues and expenditures as a share of state-level GDP correlate with the political leaning of each state,” they wrote. “Therefore, in this sense, political leaning might not play a dominant role in state and local government finances.”
Still, the authors cautioned that this simple exercise overlooks many aspects.
“We do not examine the composition of revenues and expenditures across states, which may vary with political leaning,” they wrote. “In addition, a state's position on the political spectrum might also reflect on other issues that fall outside government finances, such as gay marriage or immigration.”
Notes and References
1 The correlation coefficient measures the linear relationship between two variables and ranges from –1 to 1, where –1 indicates a perfect negative relationship, 0 indicates no linear relationship, and 1 indicates a perfect positive relationship.
Additional Resources
- Economic Synopses: Does a State’s Political Stance Impact Its Government Revenues and Spending?
- On the Economy: How Highway Stimulus Spending Turned into a Dead End
- On the Economy: Which Was Bigger: The 2009 Recovery Act or FDR's New Deal?
Citation
ldquoDo Red and Blue States Differ on Government Finances?,rdquo St. Louis Fed On the Economy, Feb. 8, 2018.
This blog offers commentary, analysis and data from our economists and experts. Views expressed are not necessarily those of the St. Louis Fed or Federal Reserve System.
Email Us
All other blog-related questions

