


Storm Clouds Approaching the Housing Market
KEY TAKEAWAYS
- A few indicators suggest the housing market is a bright spot in an otherwise gloomy outlook for the U.S. economy.
- This housing cycle is likely to be different from previous ones and may not forecast the economy’s direction as it has in the past.
- Forward-looking indicators suggest a weak outlook both for housing and for the economy.

Housing starts and sales of new and existing homes have increased sharply in recent months. In addition, house prices increased 4.4% in real terms in the 12 months through July, the largest gain in four years.Based on the CoreLogic National Home Price Index, deflated by the Bureau of Labor Statistics’ Consumer Price Index for Urban Consumers. If the housing market is a harbinger of things to come for the broader economy, do these positive signs point to a broader recovery in the near future?
Unfortunately, there is no ironclad rule that translates signs of strength in the housing market into a strong economy. Current circumstances are so unusual that a burst of housing strength alone may not predict broader trends. Moreover, the housing market itself may not be as strong as a selective reading of recent data might suggest.
Housing as a Leading Indicator
Housing data such as mortgage rates, home sales, house prices and residential investment have a good track record in forecasting recessions.See articles by William R. Emmons: “Recession Signals: Four Housing Indicators to Watch in 2019,” Housing Market Perspectives, Dec. 6, 2018, and “Recession Signals: Housing Indicators Remain Consistent With a Broader Slowdown in 2020," Housing Market Perspectives, Dec. 17, 2019. In particular, all four indicators weakened before the 1990-91, 2001 and 2007-09 recessions. During the fall of 2019, these indicators appeared to signal the possibility of a new recession beginning in late 2019 or early 2020.The current recession began after monthly economic activity peaked in February. In terms of quarterly activity, however, economic activity peaked in the fourth quarter of 2019 because of the severity of the drop in March’s economic activity, according to the National Bureau of Economic Research’s Business Cycle Dating Committee.
Of course, the coronavirus pandemic slammed the U.S. in the first quarter of 2020, triggering a deep recession that had little to do with housing. We will never know if the recession signaled by housing indicators would have occurred had the pandemic not materialized.
Not only have housing data served as good leading indicators for the onset of a recession, but they also have done a good job signaling the subsequent recovery. With the exception of the 30-year mortgage rate, which continued to decline for up to two years after the onset of the last three recessions, the other indicators (sales, prices and investment) all bottomed out no later than two quarters into the recession. Because those recessions each lasted between three and six quarters, the housing sector’s early upturn can be interpreted as a leading indicator for economic recovery.
Could This Time Be Different?
Recent strength in housing starts, home sales and house prices could be sending misleading signals in these unusual times for two reasons.
First, the housing recovery in recent months may have been driven mainly by the falling mortgage rate, not prospects for broad economic recovery.See William R. Emmons, “Why Haven’t Mortgage Rates Fallen Further?” Housing Market Perspectives, June 15, 2020. Indeed, that could be the primary reason housing markets begin to recover before the rest of the economy in any recession. In other words, the ability of housing indicators to “predict” the beginning and end of a recession could be an artifact of movements in mortgage rates, the response of housing markets and the typical length of a recession in recent decades.
As shown in my 2019 article, the mortgage rate generally increases until a year or two before a recession; it then declines for one to three years after the recession onset. Around the 1990-91 recession, for example, the mortgage rate declined for almost five years—beginning early in 1989 and bottoming out only in mid-1993.To be precise, the mortgage rate declined for almost five years relative to its own 12-quarter moving average. See the articles cited in Endnote 2 for more details. The housing recovery that began in 1991 may have been powered primarily by the falling mortgage rate, not improvements in broader economic conditions.
As for the second and even more compelling reason, the coronavirus shock that hit the economy this year and the policy responses that followed are unlike anything in recent history. It is possible this recession and the subsequent recovery will be different, too, even though the mortgage-rate cycle so far conforms to earlier cycles.
Judging from the yields of long-term Treasury securities, investors expect economic activity to be very weak for a very long time. For example, the 10-year Treasury yield expected to prevail 10 years in the future—the 10-year forward rate for 10-year Treasuries—is just 1.8%, the lowest since at least 1953. Rather than turning up soon, the long-term Treasury forward rate suggests the 30-year mortgage rate—and economic activity—could remain at a very low level long into the future.
Negative Housing Signals Are Accumulating
Even though home sales, house prices and residential investment have shown signs of vigor in recent months, other bellwethers point to trouble ahead for housing and for the economy.
Mortgage Delinquencies
The Mortgage Bankers Association reported that 4.4% of first-lien mortgages were at least 90 days past due or in foreclosure at the end of the second quarter of 2020. (See Figure 1.)
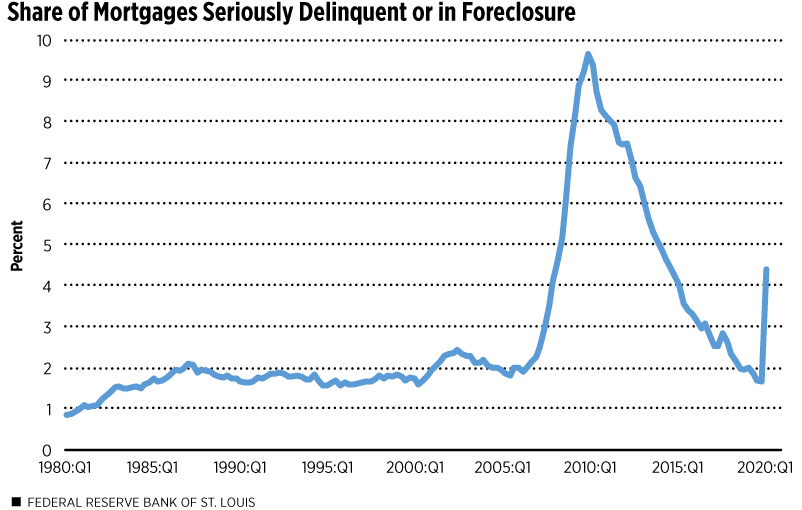
SOURCE: Mortgage Bankers Association.
NOTES: The quarterly data are the share of first-lien mortgages that are at least 90 days past due but not in foreclosure, plus the share of first-lien mortgages in the foreclosure process. The data begin in the first quarter of 1980 and run through the second quarter of 2020.
DESCRIPTION: Before the Great Recession of 2007-09, this indicator mostly hovered around 2%. During the Great Recession, the measure increased sharply, peaking at 9.65% in the first quarter of 2010 before steadily falling. The share of mortgages seriously delinquent or in foreclosure increased from 1.66% in the first quarter of 2020 to 4.40% in the second quarter.
This is the highest level since the end of the foreclosure crisis. Some nonpaying mortgage borrowers are protected by temporary foreclosure moratoriums, but the uncertain economic outlook means the risk that many will default remains high.
Banks’ Loan-Loss Provisions
Banks must set aside reserves out of current earnings to absorb likely future losses on the loans they make. Banks take into account temporary factors like foreclosure moratoriums and other information, some of it nonpublic, that makes banks the best judges of likely loan losses. The recent spike in large banks’ loan-loss provisions therefore is a credible signal of serious problems ahead for many borrowers.Another relevant factor is the transition underway this year to new bank accounting standards for expected loan losses. (See Figure 2.)
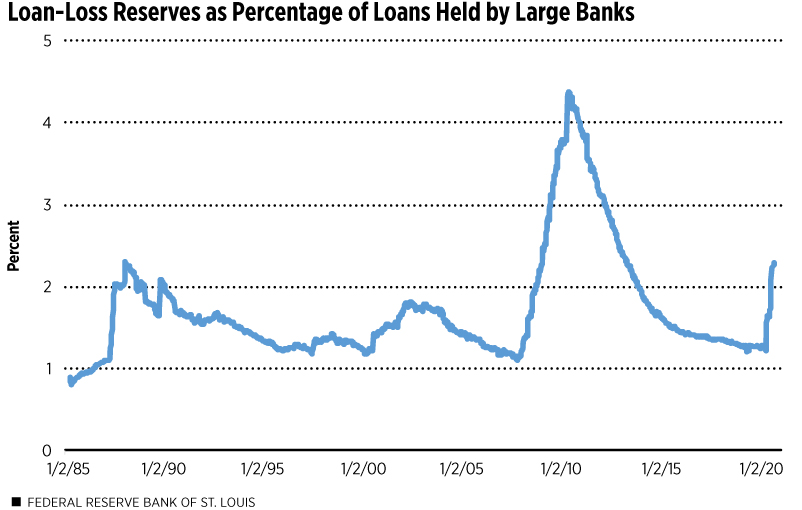
SOURCE: Federal Reserve Board.
NOTES: The weekly data are the allowance for loan and lease losses (ALLL) as a percentage of all loans and leases held by large commercial banks; this is a measure of expected loan losses. These large banks are “category one” institutions that collectively hold 66% of all assets owned by domestically chartered commercial banks. See the Federal Reserve’s weekly H.8 release for details. The data begin in April of 1985 and run through September 2, 2020.
DESCRIPTION: Large banks’ loan-loss reserves increased sharply in the late 1980s in anticipation of defaults on loans to emerging and developing economies and to commercial real-estate borrowers primarily. During this period, these reserves as a percentage of all loans reached 2.30% in early January 1988 before easing and stabilizing under 2% until the financial crisis. Banks’ loan-loss reserves rose even higher during the Great Recession and its aftermath in anticipation of defaults by domestic commercial and household borrowers, with the percentage reaching as high as 4.37% in May 2010. Large banks increased their loss reserves from 1.21% of loans at the end of March 2020 to 2.29% at the beginning of September 2020.
Banks’ Lending Standards
Another important indicator of future housing and other economic conditions is how lax or restrictive banks are when they make new loans. In contrast to loan-loss provisions, which reflect loans already made, banks’ lending standards are an indicator of what economists call credit supply—the terms and standards on which banks are willing to make additional loans. Tightening standards are likely to result in fewer loans being made in the future, which could weaken housing activity.
The latest Federal Reserve Senior Loan Officer Opinion Survey reflects banks’ lending standards in July relative to those that prevailed in April. (See Figure 3.) Credit standards for mortgages tightened sharply over the early summer, suggesting the credit supply for mortgage lending will be a restraining factor in the months ahead.
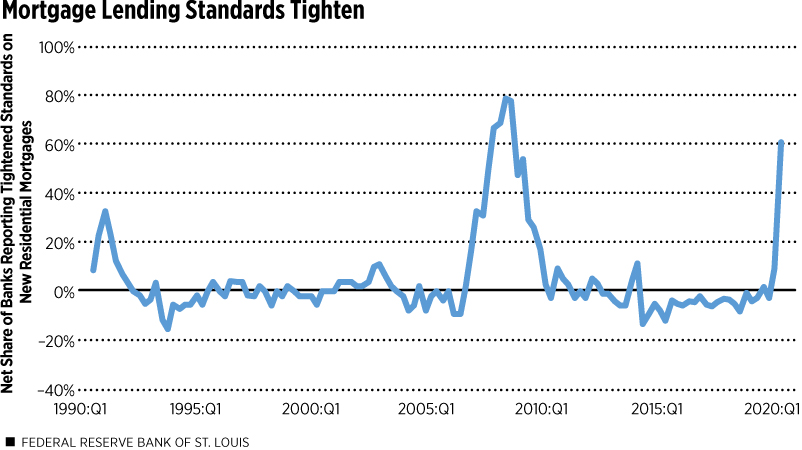
SOURCES: Federal Reserve Board and Haver Analytics.
NOTES: The quarterly data are the net share of banks responding to the Federal Reserve’s Senior Loan Officer Opinion Survey that they had tightened lending standards on new residential mortgages in the previous three months; the net share is computed as the percentage of banks that reported tightening minus the percentage of banks that reported easing standards. Banks also may report that they made no changes in lending standards, in which case they are disregarded. The survey results begin in the third quarter of 1990 and run through the third quarter of 2020 (the survey was conducted in July).
DESCRIPTION: The net share of banks reporting tighter lending standards on residential mortgages reached about 33% in the first quarter of 1991 before easing; for the rest of the 1990s and up through 2006, the net share mainly fluctuated between 5% and -5%. At its peak during the Great Recession, this measure of tightening credit supply reached about 79% in the third quarter of 2008. The net share of banks tightening standards was -3% in the first quarter of 2020, indicating a slight easing of standards overall. In the third quarter of 2020, the net share of banks tightening standards on new residential mortgage lending reached 61%.
Consumer Confidence
The survey evidence from August shows consumer confidence near a six-year low. (See Figure 4.) Despite a surging stock market and falling unemployment, consumers remained wary about the future. If consumer confidence remains subdued, it is unlikely that housing will continue to be strong.
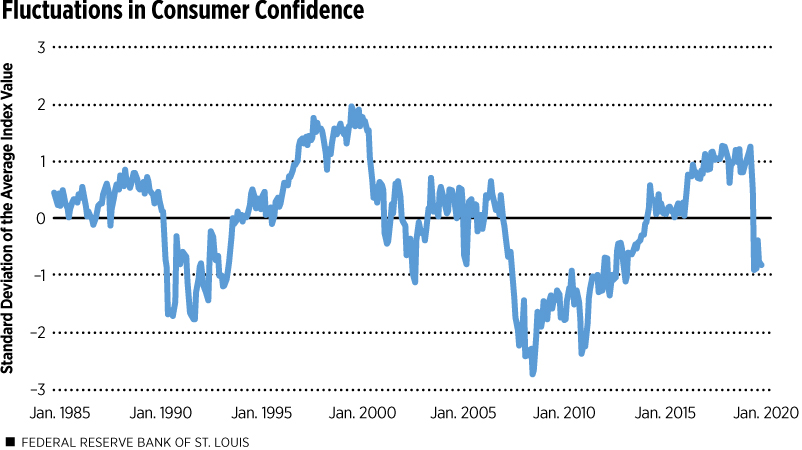
SOURCES: The Conference Board, the University of Michigan and author's calculations.
NOTES: The monthly data are a standardized combined version of two measures of consumer confidence. First, I standardized both the Conference Board’s and the University of Michigan’s indexes by subtracting each month’s index value from the average index value calculated for the entire period (January 1985-August 2020) and then dividing it by the index’s standard deviation; this makes the two measures directly comparable. I then added the two standardized measures and divided by two. By construction, the average value of the standardized consumer-confidence measures is zero. A reading of 1 indicates the combined standardized consumer-confidence measure was one standard deviation above its average during that 35-year period.
DESCRIPTION: This measure of consumer confidence was relatively high as recently as February 2020, when it was 1.26. The measure dropped to -0.90 in April, and was -0.82 in August 2020, both relatively low readings.
Uncertainty Clouds the Outlook
The unprecedented nature of the current recession and associated economic policy responses makes forecasting more difficult than usual. Housing indicators have served as good leading indicators of recessions and recoveries in the past, but there is no guarantee that the current strength in a few housing indicators is a reliable portent of broader economic strength.
Endnotes
- Based on the CoreLogic National Home Price Index, deflated by the Bureau of Labor Statistics’ Consumer Price Index for Urban Consumers.
- See articles by William R. Emmons: “Recession Signals: Four Housing Indicators to Watch in 2019,” Housing Market Perspectives, Dec. 6, 2018, and “Recession Signals: Housing Indicators Remain Consistent With a Broader Slowdown in 2020," Housing Market Perspectives, Dec. 17, 2019.
- The current recession began after monthly economic activity peaked in February. In terms of quarterly activity, however, economic activity peaked in the fourth quarter of 2019 because of the severity of the drop in March’s economic activity, according to the National Bureau of Economic Research’s Business Cycle Dating Committee.
- See William R. Emmons, “Why Haven’t Mortgage Rates Fallen Further?” Housing Market Perspectives, June 15, 2020.
- To be precise, the mortgage rate declined for almost five years relative to its own 12-quarter moving average. See the articles cited in Endnote 2 for more details.
- Another relevant factor is the transition underway this year to new bank accounting standards for expected loan losses.
This article originally appeared in our Housing Market Perspectives publication.

Citation
William R. Emmons, ldquoStorm Clouds Approaching the Housing Market,rdquo St. Louis Fed On the Economy, Sept. 29, 2020.
This blog offers commentary, analysis and data from our economists and experts. Views expressed are not necessarily those of the St. Louis Fed or Federal Reserve System.
Email Us
All other blog-related questions