Why Haven’t Mortgage Rates Fallen Further?
KEY TAKEAWAYS
- The current spread between the 30-year mortgage rate and the 10-year Treasury is historically large, as the mortgage rate has fallen less than the longer-term Treasury yield.
- Factors in the retail mortgage market rather than in the wholesale mortgage market may be slowing the fall in the mortgage rate.
- Such factors may be temporary. If the 30-year mortgage rate follows past patterns found in times of volatility, the rate could fall to a historic low below 3%.
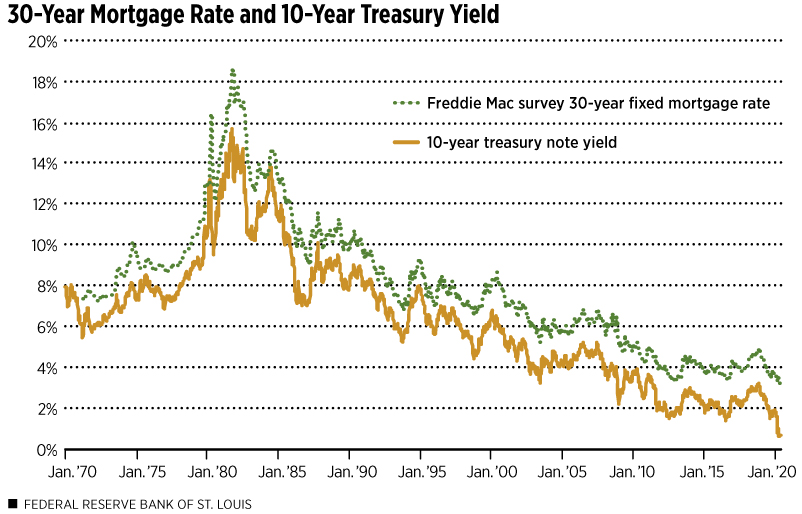
The 30-year mortgage rate generally follows long-term Treasury yields, but the difference, or spread, is not constant. (See Figure 1.) Since the beginning of 2020, the 10-year Treasury yield has declined by 1.2 percentage points, but the mortgage rate has declined by less than 0.6 percentage points. The Federal Reserve is concerned about the incomplete transmission of Treasury yield declines to mortgage borrowers because changes in mortgage rates are an important way monetary policy affects the economy.
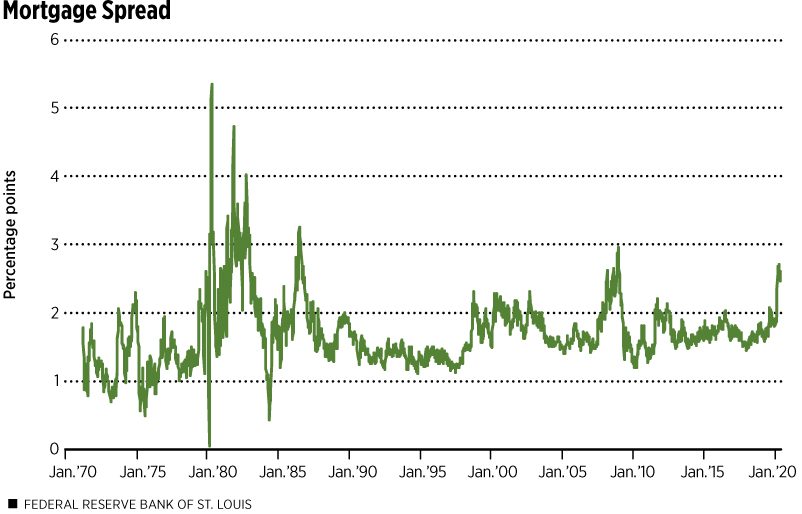
The current mortgage spread of about 2.5 percentage points is historically large. (See Figure 2.) The spread was higher for a few weeks in late 2008, during the depths of the financial crisis. Before that, the last time spreads were this large was in 1986.
Why haven’t mortgage rates followed Treasury yields more closely as they declined this year? This article explores two possibilities, corresponding to the two major links in the chain that connects capital markets to mortgage borrowers:
- The primary mortgage market is where individual homeowners borrow from a financial institution; this is the retail mortgage market.
- The secondary mortgage market is where financial institutions sell bundles of mortgage loans to “securitizers,” including Fannie Mae, Freddie Mac, Ginnie Mae and private banks, that then sell mortgage-backed securities to investors; this is the wholesale mortgage market.

SOURCES: Freddie Mac and Federal Reserve Board.
NOTE: Data are weekly averages.
DESCRIPTION: The figure shows the fluctuating 30-year mortgage rate and the 10-year Treasury yield from January 1970 to May 28, 2020. During the past half century, mortgage rates and the Treasury yield followed closely; the mortgage rate was roughly 1 to 2 percentage points higher than the 10-year Treasury year for most of that period. That difference increased sharply in recent months as the decline in the Treasury yield was greater than the decline in the mortgage rate.

SOURCES: Freddie Mac, Federal Reserve Board and author’s calculations.
NOTES: The mortgage spread is the difference between the Freddie Mac Survey 30-year mortgage rate and the 10-year Treasury yield. Data are weekly averages.
DESCRIPTION: The figure shows the mortgage spread from January 1970 to May 28, 2020. The spread is roughly 1 to 2 percentage points for most of the period, with spikes during periods of extreme rate volatility.
The evidence presented here points to factors in the primary (retail) mortgage market as the reason why mortgage rates are unusually high compared with Treasury yields. These factors may include capacity constraints in mortgage origination or servicing, increased risk aversion among lenders or slacker competition between originators than is typical. Some observers suggest many leading nonbank mortgage originators and servicers are financially weak, preventing complete pass-through of capital-market yields to household borrowers. If this episode turns out like earlier periods, these factors will fade after a brief period and mortgage rates may decline. If not, reforms of the mortgage origination or servicing sectors may be in order.
More broadly, the fact that mortgage rates have not declined as much as long-term Treasury yields means that monetary policy has had a weaker impact on the economy than the drop in Treasury yields alone would suggest. If long-term Treasury yields remain very low and conditions in the retail mortgage market return to normal, mortgage rates will decline in the near future.
I begin by briefly describing the two links in the chain connecting capital markets to individual mortgage borrowers. I then examine two recent periods for evidence about why mortgage rates have not declined as much as Treasury yields.
The Secondary (Wholesale) Mortgage Market
Buyers of federally guaranteed mortgage-backed securities (MBSs) factor two financial components into the price they are willing to pay for MBSs—compensation for the pure time value of the money being invested and compensation for the interest-rate risk associated with mortgage investments. The former typically is approximated by the yield on a Treasury security of equivalent duration, such as a 10-year Treasury.Duration is based on maturity, but it also reflects the timing of cash flows a fixed-income investor receives; duration is used to determine a bond's sensitivity to interest rate changes. Duration is always less than or equal to maturity and, unlike maturity, which is fixed at issuance, it changes over time and must be estimated with a model. The important differences between duration and maturity explain why a 30-year mortgage typically is compared with a 10-year Treasury for analytical purposes. It is because their durations are similar. The latter is due primarily to the option of mortgage borrowers to prepay their mortgage principal at face value at any time without penalty.Prepayment of principal requires the mortgage investor to find a new investment. Most often, prepayment occurs when interest rates have declined and reinvestment opportunities are less attractive than when the mortgage was originated. Investors anticipate this scenario and require borrowers to compensate them by paying a higher mortgage rate than if there were no prepayment option or if borrowers were required to pay a fee to exercise the option.
Mortgage rates follow long-term Treasury yields closely due to the first factor noted above. The spread between mortgage rates and Treasury yields varies over time, in large part, because of the second factor. (I discuss the other major source of spread variation in the next section.) The secondary-mortgage spread therefore shows the market-determined price of mortgage interest-rate risk over time. This quantity is very sensitive to broader financial conditions like recessions, financial crises and changes in government policy in the housing and mortgage markets.
The Primary (Retail) Mortgage Market
Most mortgage originators—especially those that are not banks—operate like brokers or dealers in mortgages. That is, they keep one eye on the wholesale market—the prices paid by Fannie Mae and Freddie Mac for mortgages—and the other eye on retail mortgage-market conditions. This is known as the “originate-to-distribute” model of mortgage lending, in contrast to the “buy-and-hold” model of mortgage lending that was the norm 50 years ago.A buy-and-hold lender (also called a portfolio lender) profits on the difference between the average rate on mortgages owned and the lender’s cost of funds, minus any losses on the loans and after paying all overheads, including compensation for risk and a profit margin.
The retail mortgage market generally is very competitive, so the difference between the Freddie Mac Survey 30-year mortgage rate (the retail price) and the yield on Fannie or Freddie mortgage-backed securities (the wholesale price) reflects the gross profit margin available to a mortgage originator. This must cover marketing costs, short-term financing costs, other overheads and compensation for risk; net profit is what is left over.
Even though the retail mortgage market appears to be very competitive most of the time, there are periods when it seems that gross profit margins are unusually high. As described below, the current period appears to be one of them.
Comparing the Current Situation with the Financial Crisis
I focus on two recent periods when mortgage spreads were large—2007-09 and 2018-20—to examine the two components of the overall mortgage spread—the primary- and secondary-market spreads—more closely. (See Figures 3 and 4.) In each case, both components contributed to the widening of the total mortgage spread to historically high levels. In both cases, large-scale purchases of MBSs by the Federal Reserve probably contributed to large and abrupt declines in secondary-market spreads.
If the current episode tracks the 2007-09 period in qualitative terms, we should expect primary-market spreads to decline in the near future. If long-term Treasury yields remain very low, this would translate into a decline in the 30-year mortgage rate of a half percentage point or more. This would put the mortgage rate below 3%, the lowest in more than 50 years.
The 2007-09 Period
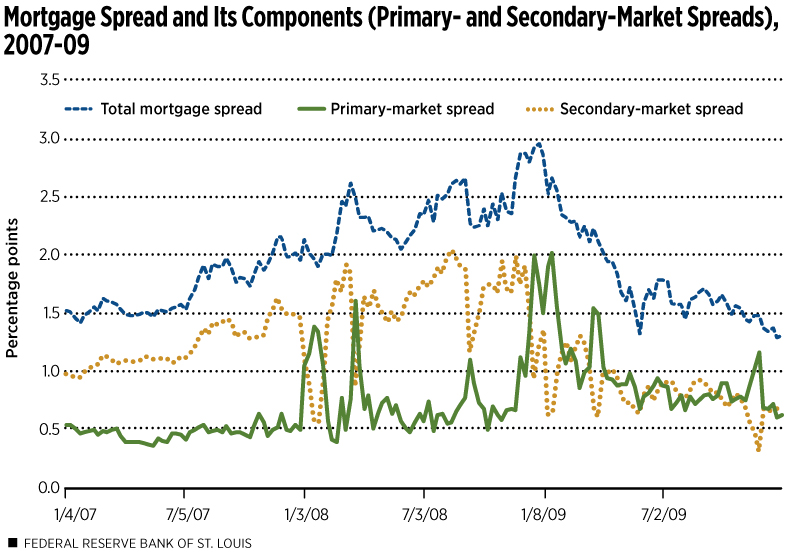
Figure 3 shows the weekly total mortgage spread and its two components, corresponding to retail and wholesale margins, from 2007 to 2009. The total spread rose from about 1.5 percentage points at the beginning of 2007 to almost 3 percentage points at the end of 2008. Through most of those 24 months, the principal contributor to the increase was an expansion of the secondary-market spread, which increased by about 1 percentage point. This reflects the build-up of financial turmoil and uncertainty about government policy in the housing and mortgage markets during that period.

SOURCES: Freddie Mac, ICE BofA Merrill Lynch, Federal Reserve Board and author’s calculations.
NOTES: Total mortgage spread is the difference between the Freddie Mac Survey 30-year mortgage rate and the 10-year Treasury yield. Secondary-market spread is the difference between the Fannie Mae 30-year current coupon mortgage-backed security yield to maturity and the 10-year Treasury yield. Primary-market spread is the difference between the Freddie Mac Survey 30-year mortgage rate and the Fannie Mae 30-year current coupon mortgage-backed security yield to maturity. Data are weekly averages.
DESCRIPTION: The figure shows mortgage spreads from 2007 to 2009. The total mortgage spread increased from around 1.5 percentage points in mid-2007 to nearly 3 percentage points by December 2008; the increase was spurred mainly by a rising secondary-market spread. During 2009, the total market spread slowly declined, falling to around 1.3 percentage points by the end of the year as the secondary-market spread dropped.
Short-lived spikes in the primary-market spread, mirrored by sharp declines in the secondary-market spread, occurred in January, March and September 2008. The underlying data confirm that the source of these reversals was erratic changes in the MBS yield, which is common to both spreads but appears in them with opposite signs.
Each of those months contained a serious financial disturbance that may have increased uncertainty about the status of Fannie Mae and Freddie Mac MBSs and, hence, could explain extreme volatility in their yields:
- In January, the stock market dropped sharply and the Federal Reserve responded with an interest-rate cut.
- In March, Bear Stearns was rescued by JPMorgan and the Federal Reserve.
- In September, a global financial panic caused a near collapse of the U.S. financial system.
A more relevant period for comparison with 2020 occurred in late 2008 and early 2009, as shown in the table below.
| Primary-Market Spread | Secondary-Market Spread | Total Mortgage Spread | |
|---|---|---|---|
| Percentage Points | |||
| Nov. 20, 2008 | 0.67 | 1.99 | 2.66 |
| Nov. 27, 2008 | 1.12 | 1.75 | 2.87 |
| Dec. 4, 2008 | 0.96 | 1.91 | 2.87 |
| Dec. 11, 2008 | 1.33 | 1.47 | 2.80 |
| Dec. 18, 2008 | 2.00 | 0.93 | 2.93 |
| Dec. 25, 2008 | 1.75 | 1.21 | 2.96 |
| Jan. 1, 2009 | 1.50 | 1.36 | 2.86 |
| Jan. 8, 2009 | 1.90 | 0.63 | 2.53 |
| Jan. 15, 2009 | 2.02 | 0.60 | 2.66 |
| Jan. 22, 2009 | 1.55 | 1.01 | 2.56 |
| Jan. 29, 2009 | 1.20 | 1.15 | 2.35 |
| Feb. 5, 2009 | 1.07 | 1.26 | 2.33 |
| Feb. 12, 2009 | 1.19 | 1.09 | 2.28 |
| SOURCES: Freddie Mac, ICE BofA Merrill Lynch, Federal Reserve Board and author’s calculations. | |||
| NOTES: Data are weekly averages. Total mortgage spread is the difference between the Freddie Mac Survey 30-year mortgage rate and the 10-year Treasury yield. Secondary-market spread is the difference between the Fannie Mae 30-year current coupon mortgage-backed security yield to maturity and the 10-year Treasury yield. Primary-market spread is the difference between the Freddie Mac Survey 30-year mortgage rate and the Fannie Mae 30-year current coupon mortgage-backed security yield to maturity. | |||
Rather than a short-lived mirror-image disturbance in the two spreads, the secondary-market spread dropped by about a full percentage point between the weeks of Dec. 4, 2008, and Dec. 18, 2008, and then stabilized around 1 percentage point. This was when the Federal Reserve announced that it would buy Treasury securities and MBSs on a hitherto unprecedented scale.
Initially, the primary-market spread spiked higher in an equal and opposite direction, increasing about 1 percentage point. This was a purely mechanical adjustment in the sense that the total spread was little changed and the primary-market spread was adjusting passively.
The primary-market spread remained near 2 percentage points for four weeks after Dec. 18, 2008. Only then, in the weeks after Jan. 15, 2009, did it return to a level closer to 1 percentage point, where it had been until mid-December. This episode suggests that the 30-year mortgage rate and the primary-market spread are sluggish to adjust, even to a persistent change in the level of the MBS yield.
The 2018-20 Period
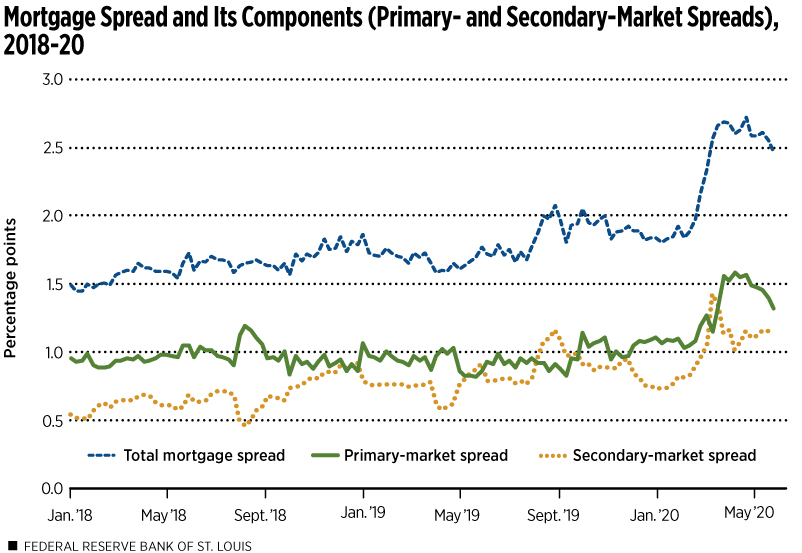
Figure 4 shows the weekly total mortgage spread and its two components, corresponding to retail and wholesale margins, during 2018-20, with the latest observation from the week of May 28, 2020.

SOURCES: Freddie Mac, ICE BofA Merrill Lynch, Federal Reserve Board and author’s calculations.
NOTES: Total mortgage spread is the difference between the Freddie Mac Survey 30-year mortgage rate and the 10-year Treasury yield. Secondary-market spread is the difference between the Fannie Mae 30-year current coupon mortgage-backed security yield to maturity and the 10-year Treasury yield. Primary-market spread is the difference between the Freddie Mac Survey 30-year mortgage rate and the Fannie Mae 30-year current coupon mortgage-backed security yield to maturity. Data are weekly averages.
DESCRIPTION: The figure shows mortgage spreads from Jan. 4, 2018 to May 28, 2020. The total mortgage spread began to slowly rise from around 1.5 percentage points to just over 2 percentage points by August 2019, mostly because of the rising secondary-market spread; the total spread then slips to around 1.8 percentage points by the end of the year. In February 2020, the total spread again rises as both the primary- and secondary-market spreads increase, and it reaches a high of 2.72 percentage points by April 23, then declining 0.25 percentage points by the end of May as the primary-market spread declined by the same amount.
The secondary-market spread showed a slight upward trend during 2018 and 2019, moving from about 0.5 percentage points at the beginning of 2018 to a bit below 1 percentage point at the end of 2019. The primary-mortgage market exhibited essentially no trend, remaining around 1 percentage point at the end of 2019.
Beginning in mid-February 2020, the secondary-market spread increased about 0.60 percentage points to a high of 1.42 by the week of March 12. (See Table 2.) Meanwhile, the primary-market spread moved little, on balance. During the next four weeks, the secondary-market spread declined 0.40 percentage points, before rising slightly. It was in this period that the sluggish adjustment of the primary-market spread appeared in the form of a nearly equal and opposite movement compared with the secondary-market spread. If the experience of prior periods recurs, we should expect the primary-market spread to return to its level of about 1 percentage point. This would be consistent with a decline in the 30-year mortgage rate of about 0.5 percentage points, to around 3%.
| Primary-Market Spread | Secondary-Market Spread | Total Mortgage Spread | |
|---|---|---|---|
| Percentage Points | |||
| Feb. 13, 2020 | 1.05 | 0.83 | 1.88 |
| Feb. 20, 2020 | 1.08 | 0.89 | 1.97 |
| Feb. 27, 2020 | 1.19 | 0.97 | 2.16 |
| March 5, 2020 | 1.27 | 1.06 | 2.33 |
| March 12, 2020 | 1.15 | 1.42 | 2.57 |
| March 19, 2020 | 1.32 | 1.34 | 2.66 |
| March 26, 2020 | 1.55 | 1.14 | 2.69 |
| April 2, 2020 | 1.52 | 1.16 | 2.68 |
| April 9, 2020 | 1.58 | 1.02 | 2.60 |
| April 16, 2020 | 1.55 | 1.08 | 2.63 |
| April 23, 2020 | 1.57 | 1.15 | 2.72 |
| April 30, 2020 | 1.49 | 1.10 | 2.59 |
| May 7, 2020 | 1.47 | 1.12 | 2.59 |
| May 14, 2020 | 1.45 | 1.16 | 2.61 |
| May 21, 2020 | 1.39 | 1.16 | 2.55 |
| May 28, 2020 | 1.32 | 1.15 | 2.47 |
| SOURCES: Freddie Mac, ICE BofA Merrill Lynch, Federal Reserve Board and author’s calculations. | |||
| NOTES: Data are weekly averages. Total mortgage spread is the difference between the Freddie Mac Survey 30-year mortgage rate and the 10-year Treasury yield. Secondary-market spread is the difference between the Fannie Mae 30-year current coupon mortgage-backed security yield to maturity and the 10-year Treasury yield. Primary-market spread is the difference between the Freddie Mac Survey 30-year mortgage rate and the Fannie Mae 30-year current coupon mortgage-backed security yield to maturity. | |||
Conclusions
The failure of the 30-year mortgage rate to decline in recent weeks in lockstep with the 10-year Treasury yield probably reflects sluggish adjustment in the primary mortgage market to changed circumstances. This pattern occurred in previous episodes of sharp movements in Treasury and MBS yields. If the primary market follows historical patterns, we would expect a further decline in mortgage rates of perhaps 0.5 percentage points. This would bring mortgage rates to an historic low.
Endnotes
- Duration is based on maturity, but it also reflects the timing of cash flows a fixed-income investor receives; duration is used to determine a bond's sensitivity to interest-rate changes. Duration is always less than or equal to maturity and, unlike maturity, which is fixed at issuance, it changes over time and must be estimated with a model. The important differences between duration and maturity explain why a 30-year mortgage typically is compared with a 10-year Treasury for analytical purposes. It is because their durations are similar.
- Prepayment of principal requires the mortgage investor to find a new investment. Most often, prepayment occurs when interest rates have declined and reinvestment opportunities are less attractive than when the mortgage was originated. Investors anticipate this scenario and require borrowers to compensate them by paying a higher mortgage rate than if there were no prepayment option or if borrowers were required to pay a fee to exercise the option.
- A buy-and-hold lender (also called a portfolio lender) profits on the difference between the average rate on mortgages owned and the lender’s cost of funds, minus any losses on the loans and after paying all overheads, including compensation for risk and a profit margin.
This article originally appeared in our Housing Market Perspectives publication.
Citation
William R. Emmons, ldquoWhy Haven’t Mortgage Rates Fallen Further?,rdquo St. Louis Fed On the Economy, June 15, 2020.
This blog offers commentary, analysis and data from our economists and experts. Views expressed are not necessarily those of the St. Louis Fed or Federal Reserve System.
Email Us
All other blog-related questions


