Tracking the Economic Impact of the Pandemic Using High-Frequency Data

Many of the key indicators used to measure regional economic conditions are released monthly or quarterly, making them potentially appear outdated by the time they’re available.
A Regional Economist article recently explored the increasing use of high-frequency data, which can provide economic insights in real time.
Regional Economist Charles Gascon and Research Intern Amelia Schmitz gave several examples of data sources that can provide a quick snapshot of economic activity. Their article focuses on data in the labor market, consumer spending and residential real estate during the coronavirus pandemic.
“As organizations have moved into the world of ‘big data,’ many have begun using their proprietary data to produce high-frequency (e.g., daily or weekly) statistics intended to capture various aspects of economic activity,” the authors wrote. “These indicators have moved to the forefront of the economic forecasting profession in recent months, because the COVID-19 outbreak has caused abrupt turning points in economic conditions.”
The Labor Market
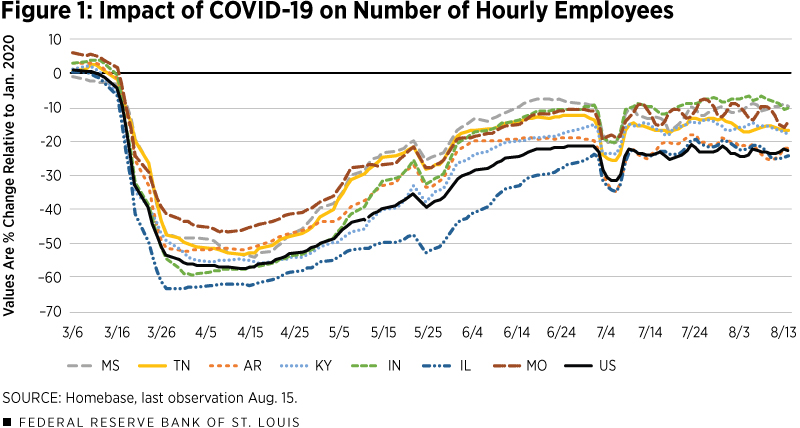
One of the resources Gascon and Schmitz examined is Homebase, a payroll processing company that can provide employment data in real time. The company’s data on hourly workers are available for the U.S., states and metro areas, though they are not seasonally adjusted. The figure below shows their snapshot of pandemic-related data for the Fed’s Eighth District.

In mid-March, the Homebase index showed a sharp decline in employment that continued in April until recovering. It also indicated that the pace of rehiring workers slowed in June in the District as well as the nation.
Consumer Spending
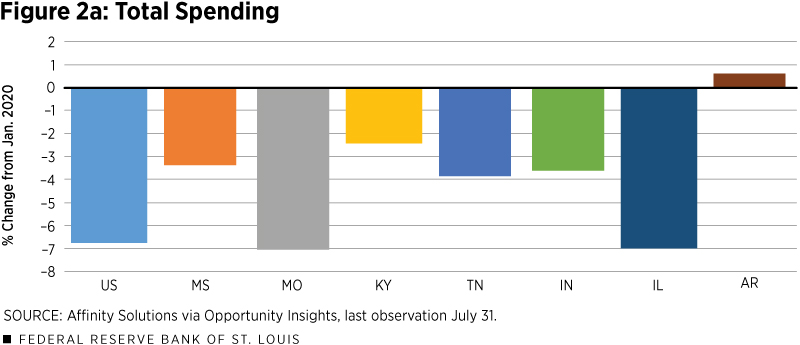
To get a quick impression of consumer spending, the authors looked at daily credit and debit spending data from Affinity Solutions via Opportunity Insights. Not only are the data seasonally adjusted, but they show consumer spending overall, as well in six major spending categories for states and cities. These categories include accommodation and food services; arts, entertainment and recreation; and groceries.
In terms of consumer spending, numbers declined significantly in the Eighth District in mid-March, but to a lesser extent than those of employment. On March 30, the national index reached a low of -33%, then steadily recovered starting in mid-April. On the same day, Illinois experienced the largest drop to a low of -38%, while spending in Tennessee reached a low of -27%.

By the end of July, national spending on accommodation and food services remained 31% below January levels, while recreation spending remained down 51%. However, spending on groceries was up about 11%, as more people began eating at home instead of in restaurants.
The Housing Market
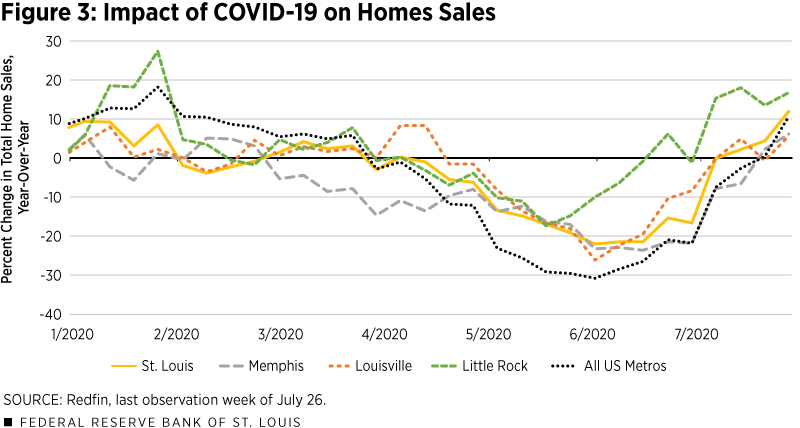
To gauge the residential real estate market, Gascon and Schmitz consulted Redfin, a real estate brokerage that collects weekly data on housing market indicators such as total sales, pending sales and price per square foot.
The figure below shows the percentage change in total home sales for the four largest metro areas in the Eighth District alongside total home sales in the U.S. in 2020. Prior to COVID-19, the housing market was strong, with nationwide home sales up 10% in January and 6% in late February from a year ago.

Unlike employment and consumer spending, which fell to their lowest points in March and April, the housing market has continued to lag, the authors wrote. Difficulties with inspections and delayed closing processes caused pending sales to remain above year-ago levels throughout March, both nationally and in three of the District’s largest metropolitan statistical areas. And activity slowed as homeowners removed listings and demand decreased.
The Overall Impact
So, while the pandemic has created unprecedented shocks to the economy, states in the Eighth District have generally fared better than the rest of the nation, the authors concluded.
“In this period of rapid changes, high-frequency data have proven to be very useful for tracking the spread of the virus throughout the country, along with the resulting economic impact,” they wrote.
Additional Resources
- Regional Economist: Using High-Frequency Data to Track the Regional Economy
- Working Paper: Forecasting Low Frequency Macroeconomic Events with High Frequency Data
- Center for Household Financial Stability: Identifying “Tipping Points” in Consumer Liabilities Using High Frequency Data (PDF)
Citation
ldquoTracking the Economic Impact of the Pandemic Using High-Frequency Data,rdquo St. Louis Fed On the Economy, Oct. 15, 2020.
This blog offers commentary, analysis and data from our economists and experts. Views expressed are not necessarily those of the St. Louis Fed or Federal Reserve System.
Email Us
All other blog-related questions

