Using High-Frequency Data to Track the Regional Economy
KEY TAKEAWAYS
- Many of the key indicators used to measure economic activity take weeks or months to become available.
- High-frequency data from proprietary sources can measure the regional economy in a timelier way—sometimes even in real time.
- An example of high-frequency data being used to measure the economy would be payroll data helping gauge employment.

Many of the key indicators used to monitor regional economic conditions are released monthly or quarterly, but this can make data appear outdated by the time they become publicly available. One of the most closely watched indicators—the unemployment rate—is released about three weeks after the end of the month for states and counties.
For example, July unemployment rate data for states were released Aug. 21. Real gross domestic product (GDP)—generally considered the broadest measure of economic activity—is released quarterly for states and annually for counties and metropolitan areas.Despite the publication lag, these measures continue to provide enormous benefit to economists and policymakers. The measures rely on statistical best practices and have been calculated on a consistent basis for many years. Without these indicators as a benchmark, many of the new metrics would not be as reliable. Moreover, government agencies have begun producing high-frequency statistics—for example, the Census Bureau’s Household Pulse Survey.
While these indicators are reliable and incredibly important, the lag in their release makes them difficult to use in accurately representing an economy, in which conditions often change quickly.
As organizations have moved into the world of “big data,” many have begun using their propriety data to produce high-frequency (e.g., daily or weekly) statistics intended to capture various aspects of economic activity. These indicators have moved to the forefront of the economic forecasting profession in recent months, because the COVID-19 outbreak has created abrupt turning points in economic conditions.These data were rarely collected initially to monitor the economy. They were primarily collected for business purposes, like tracking customer interest and preferences, so they should be interpreted with caution, because they may be subject to sampling bias or other forms of bias. We use some of these high-frequency indicators to provide an overview of current economic conditions in the Eighth Federal Reserve District.
Tracking the Labor Market
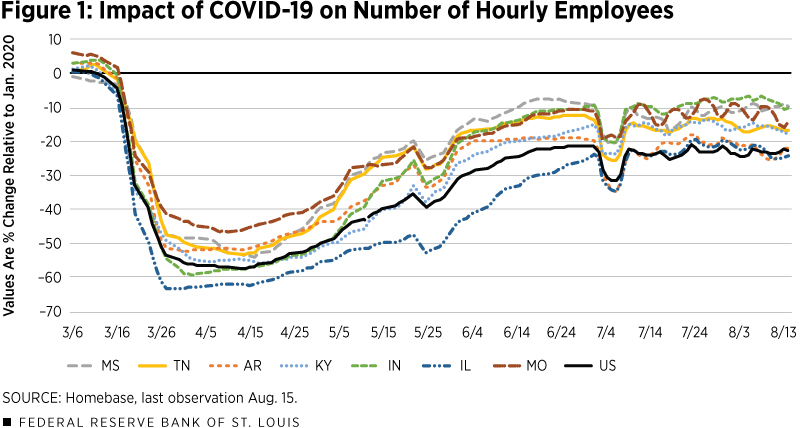
Recent research at the Federal Reserve Bank of St. Louis found that daily data from Homebase, a payroll processing company, are useful in tracking employment in real time. The data on the number of hourly workers at small businesses are available for the U.S., states and metro areas. The data are not seasonally adjusted, which explains the employment declines around Memorial Day and the Fourth of July.
The data in Figure 1 show the percentage change in number of hourly employees relative to the number in January 2020.
In mid-March, there was a sharp decline in employment, which continued until early- to mid-April before recovering. The Homebase index shows U.S. employment declined by as much as 57% relative to January 2020. However, there has been considerable variation across states. For example, Illinois reached a low of -63% on March 27, while Missouri reached a low of -47% two weeks later on April 10. The data also indicate the pace of rehiring workers has slowed since mid-June nationally as well as in many areas of the District.
Many District states are faring better than the national average of -23%. Mississippi and Indiana are only down 10%, with Missouri next at -14%. Tennessee and Kentucky are closer at -17% and -18%, respectively. Arkansas only just beats the national average at -22% and Illinois surpasses it at -24%.
Tracking Consumer Spending
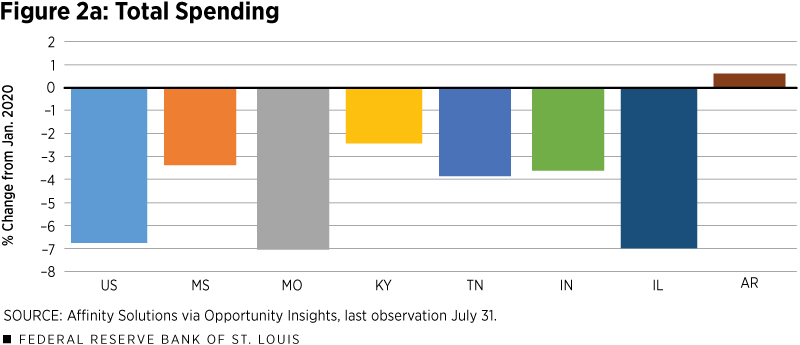
Daily credit and debit card spending data come from Affinity Solutions via Opportunity Insights. The data are reported as total consumer spending, as well as by six major spending categories for states and cities. The data are seasonally adjusted.
Total consumer spending significantly declined in mid-March, but to a lesser degree than employment. On March 30, the national index reached a low of -33% and has steadily recovered since mid-April. Again, Illinois experienced the largest drop to a low of -38% on March 30, while spending in Tennessee reached a low of -27% on the same day.
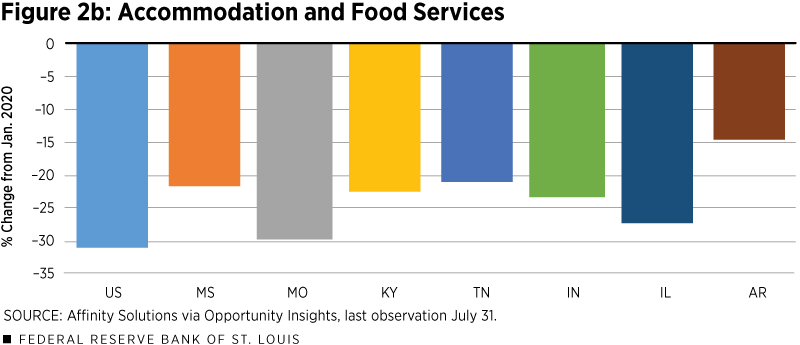
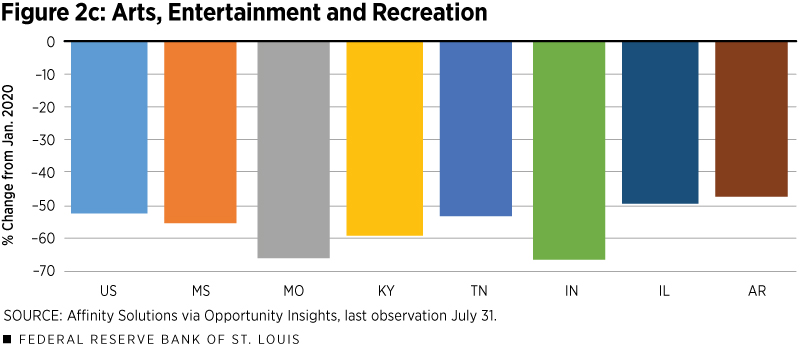
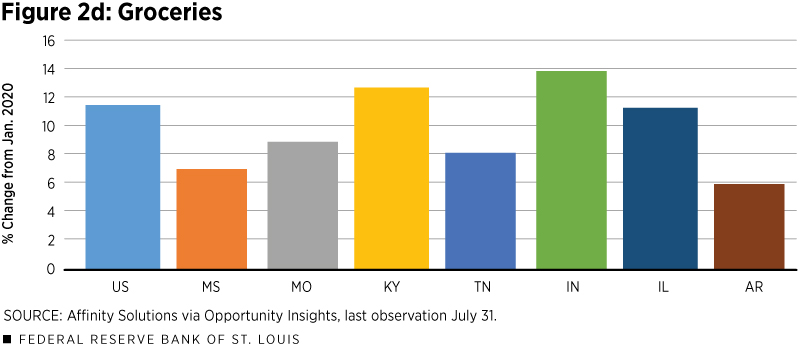
Figure 2a reports the most recent values for total spending, and Figures 2b though 2d show three spending categories. Based on these data, total spending in Tennessee had fully recovered by May 15. The data show that every District state excluding Illinois had fully recovered for at least a day by June. Kentucky, Tennessee and Arkansas all had positive changes relative to January 2020 for almost all of June. However, the most recent data points indicate spending is only up in Arkansas, and national spending remains 7% below January levels.
Many sectors continue to struggle as consumers have shifted their spending—most notably from dining out to eating at home.Other sources tracking restaurant activity include OpenTable and Yelp.
Figure 2b shows that national spending on accommodation and food services remains 31% below January levels, while Figure 2c indicates recreation spending remains down 51%. On the other hand, spending on groceries (Figure 2d) is up about 11%. Past data from the same source show that in mid-March, spending on groceries was up by much as 73% nationally. Another category not depicted in these figures is general merchandise spending, which has generally recovered.
Tracking the Housing Market
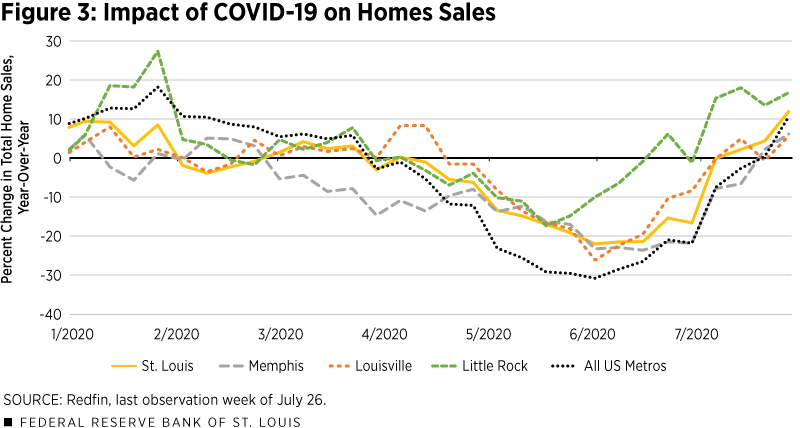
Redfin is a real estate brokerage that collects and reports weekly data on many housing market indicators, including total sales, pending sales and price per square foot. Figure 3 reports the percentage change in total home sales for the largest four metro areas in the Eighth District and the U.S. during 2020. Prior to the COVID-19 pandemic, the housing market was strong, with nationwide home sales up 10% in January and 6% in late February from one year ago, and consistent with prior years in the District’s metro areas.
Unlike employment and consumer spending, which reached their lowest points in March and April, the housing market has continued to lag. Due to difficulties with inspections and delayed closing processes, pending sales remained above year-ago levels throughout March, nationally and in three of the District’s metropolitan statistical areas (MSAs).
Activity slowed as homeowners removed listings and demand slowed during the pandemic. National home sales at the beginning of May were 31% lower than one year ago. Through early July, home sales continued to be below 2019 activity nationally and in most district MSAs, although the pace of decline slowed. They are now above 2019 levels nationally and in each District MSA. Little Rock is leading and is up 17%.
Conclusion
The COVID-19 crisis and policy response have generated unprecedented shocks to economic activity, in magnitude as well as frequency. It is likely the current recession will be the deepest and the shortest the U.S. has experienced on record. In this period of rapid changes, high-frequency data have proven to be very useful for tracking the spread of the virus throughout the country, along with the resulting economic impact.
Overall, the data cited in this paper show that Eighth District states have generally fared better than the nation during the depth of the crisis and have experienced a faster recovery. However, the July surge in COVID-19 cases, particularly in the southern District states, appears to have stalled the growth in employment and consumer spending.
Amelia Schmitz is a research intern at the Federal Reserve Bank of St. Louis.
Endnotes
- Despite the publication lag, these measures continue to provide enormous benefit to economists and policymakers. The measures rely on statistical best practices and have been calculated on a consistent basis for many years. Without these indicators as a benchmark, many of the new metrics would not be as reliable. Moreover, government agencies have begun producing high-frequency statistics—for example, the Census Bureau’s Household Pulse Survey.
- These data were rarely collected initially to monitor the economy. They were primarily collected for business purposes, like tracking customer interest and preferences, so they should be interpreted with caution, because they may be subject to sampling bias or other forms of bias.
- Other sources tracking restaurant activity include OpenTable and Yelp.
Views expressed in Regional Economist are not necessarily those of the St. Louis Fed or Federal Reserve System.
For the latest insights from our economists and other St. Louis Fed experts, visit On the Economy and subscribe.
Email Us


