


Using Data to Show When Recessions End

On June 8, the National Bureau of Economic Research (NBER) Business Cycle Dating Committee (BCDC) announced that the longest expansion in U.S. economic history (dating back to 1854) ended sometime in February, an expansion that lasted 128 months.
The 2020 recession has been the deepest on record. After falling at a 5% annual rate in the first quarter of 2020, real GDP plunged at a 31.4% rate in the second quarter. Labor markets suffered a similar drubbing. Nonfarm payrolls fell by a combined 22.2 million in March and April, and the unemployment rate skyrocketed to almost 15%.
Since then, the U.S. economy has rebounded sharply:
- Real GDP increased at a 33.1% annual rate in the third quarter.
- Nonfarm payrolls have increased by a combined 12.1 million jobs from May to October
- The unemployment rate has fallen from 14.7% in April to 6.9% in October.
On the face of it, key economic data suggest that the economy is transitioning out of recession and into recovery. The latter is thought of as the interval when the level of GDP and employment (broadly, economic activity) remains below its business expansion peak levels.
Not Officially Out of Recession Yet
As yet, though, the NBER has not announced an end to the recession. This is not surprising, since the BCDC generally prefers to wait until there is conclusive evidence that the economy has transitioned from a period of recovery to expansion.This recent FRED Blog post discusses this point in more detail. This point was emphasized in the Sept. 20, 2010, announcement that dated the end of the 2007-2009 recession:
The trough marks the end of the declining phase and the start of the rising phase of the business cycle. Economic activity is typically below normal in the early stages of an expansion, and it sometimes remains so well into the expansion.
The committee decided that any future downturn of the economy would be a new recession and not a continuation of the recession that began in December 2007. The basis for this decision was the length and strength of the recovery to date.
Considerations for Saying Recession Has Ended
It is also important to emphasize that the unique features of this pandemic-spawned recession have—as the BCDC noted in its June 8 announcement—“resulted in a downturn with different characteristics and dynamics than prior recessions.”
Thus, while the data suggest that the recession has ended, the pandemic remains a key driver of economic policy and the behavior of many governments and individuals worldwide. From that standpoint, the “length and strength” of the recovery is uncertain.
The traditional approach of the BCDC in dating peaks and troughs is to look at a few key variables of different frequencies: specifically, economic data measuring activity at monthly and quarterly frequencies. It is also noteworthy that the BCDC emphasizes economywide economic indicators when dating peaks and troughs rather than indicators that measure one or a handful of key sectors, such as industrial production.
Using these two criteria, the BCDC looks closely at real GDP and real gross domestic income, which are quarterly series. Economywide series at a monthly frequency that the BCDC has emphasized include real personal consumption expenditures, real manufacturing and trade sales, real personal income excluding current transfer receipts, nonfarm payroll employment, and civilian employment.
The Importance of More Frequent Data
But what about economywide measures at a weekly frequency? The pandemic-spawned recession has produced a flurry of new, innovative measures of economic activity at a weekly basis. Previous articles by some of my St. Louis Fed colleagues have discussed some of these measures, such as labor market, consumer spending and housing market data, as well as job posting data.
One potential higher-frequency measure the BCDC might examine is the Weekly Economic Index (WEI) developed by Harvard Professor James Stock and two Federal Reserve economists: Daniel Lewis at the New York Fed and Karel Mertens at the Dallas Fed. The WEI is a composite index of 10 weekly economic indicators, and it is designed to track the four-quarter growth rate of real GDP. This series is potentially a useful indicator to watch because James Stock is a member of the BCDC.
However, one of the WEI’s potential drawbacks, as seen in the figure below, is that the series only extends back to the first week of January 2008. Thus, there is not a long history with which to judge its cyclical accuracy. Still, the weekly series reached a trough in early 2009, which is consistent with the BCDC’s dating chronology noted above.
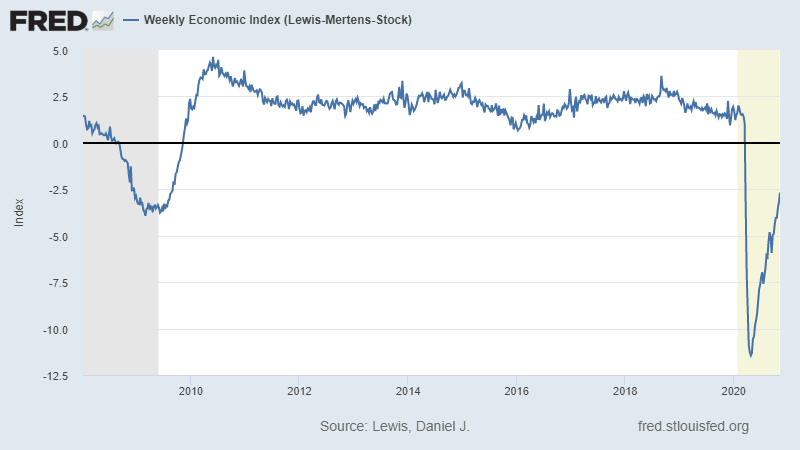
During the 2020 recession, the WEI hit its lowest point in the last week of April. Interestingly, April was also the trough month of all five of the economywide monthly indicators cited above.
The rebound in the WEI is also consistent with the increase in real GDP in the third quarter and the expectation of further gains in the fourth quarter and into 2021.
Notes and References
1 This recent FRED Blog post discusses this point in more detail.
Additional Resources
- Regional Economist: Using High-Frequency Data to Track the Regional Economy
- FRED Blog: How to read Indeed job posting data
- On the Economy: The COVID-19 Recession in Historical Perspective

Citation
Kevin L. Kliesen, ldquoUsing Data to Show When Recessions End,rdquo St. Louis Fed On the Economy, Nov. 17, 2020.
This blog offers commentary, analysis and data from our economists and experts. Views expressed are not necessarily those of the St. Louis Fed or Federal Reserve System.
Email Us
All other blog-related questions