


Learning from Experience: Why Nations May Have Responded Differently to COVID-19
The ongoing COVID-19 pandemic has hit almost all aspects and corners of the global economy. One aspect that has caught the attention of most observers is the drastic difference in the performances of countries. The characteristics of the coronavirus and its induced disease and mortality led to large differences in mortality across demographic groups, geographic locations and countries along age, density, housing conditions, the population’s health indicators and in general, the country’s healthcare systems.
The pandemic has exposed multiple vulnerabilities of various populations, be those old age (northern Italy), the prevalence of urban slums (Rio de Janeiro, Guayaquil), poor access and quality in health care (minority communities in the U.S.) and overstretched health sectors in too many countries.
Past Experiences from Pandemics
Yet, one aspect that has not been emphasized enough, in our opinion, is how a country’s past experience with epidemics may have shaped its preparedness and ensuing response to the current pandemic. In this post, we briefly examine the hypothesis that countries that more recently experienced similar types of viral epidemics were better prepared and indeed responded better to the exposure to COVID-19. To this end, we looked at the Severe Acute Respiratory Syndrome (SARS-CoV-1) pandemic of 2002-03; like the current one, this was caused by a coronavirus.
We looked at three groups of countries:
- Group 1: This is composed of countries that were directly exposed to the SARS pandemic. We defined this group as the countries with the highest number of SARS-1 infections relative to population in 2002-03, according to data from the World Health Organization (WHO). This group comprises mainland China, Hong Kong, Singapore and Taiwan.
- Group 2: This is composed of countries that were not directly affected by SARS-1 or were only affected marginally, but are in geographic proximity to any of the countries in Group 1. This group comprises Cambodia, India, Indonesia, Japan, Laos, Malaysia, Mongolia, Philippines, South Korea, Thailand and Vietnam.
- Group 3: This is a group of developed countries that are not in Groups 1 or 2. Hence, it comprises Canada, the U.S., and all Western European countries.
Notice that we have selected only developed countries in Group 3. These are the richest countries in the world, and in principle they would have superior resources at their disposal to fend off the spread of the virus and combat the disease.
Varying Mortality Rates
We first compare mortality rate differences due to COVID-19. The figure below compares the cumulative death rates across the three groups, using the simple average of the countries within in each group.Our conclusions do not change if we use the averages weighted by the population of the countries.
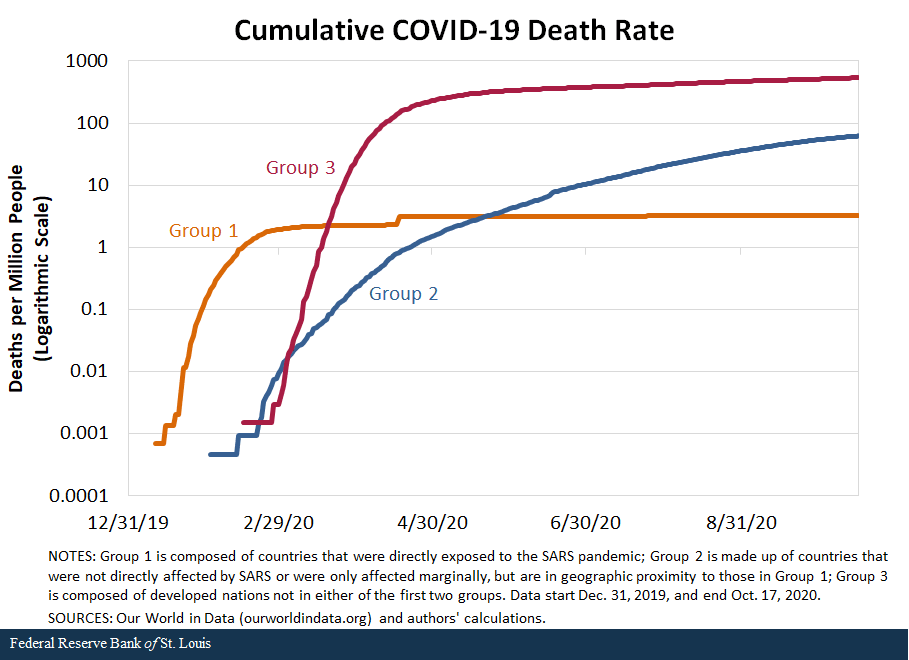
The figure shows that mortality rates picked up first in January in Group 1, simply because COVID-19 originated in this group. More interestingly, countries in Group 1 have reported a much lower mortality rate than countries in Group 2 and, especially, than those in Group 3.
The mortality rates are so different that we needed to use a logarithmic scale to be able to see them in the same figure. In fact, the average death rate from COVID-19 in Group 3 is more than 165 times greater than in Group 1 and more than 8 times greater than in Group 2.
Observing these differences in mortality rates can motivate two very different explanations. One could think that the populations in Groups 1 and 2 may be genetically better prepared to fend off COVID-19.For example, leading Japanese scientists have argued that the Japanese may have a special immunity, possibly due to previous exposure. On the other hand, the public health authorities in Groups 1 and 2 appear to have reacted in a more effective and resolute way, and their actions may help explain why these nations were able to fend off the pandemic with much lower mortality.
Government Responses
In this post, we do not attempt to invalidate the first hypothesis. Genetics is not our field, and we simply lack the genetic data at this moment. Instead, we provide some evidence that supports a role for the second hypothesis. To this end, we compared two broad measures of policies pursued by the three groups of countries:
- Testing, tracing and isolating policies
- Containment and closure policies
The next figure used data from Our World in Data to explore the response of select countries from the three groups in terms of tests by displaying the number of tests per confirmed case over time; this indicates the aggressiveness and readiness of the response of these countries in terms of the of the presence of the virus. We used only a handful of countries from each group since the data coverage is limited.
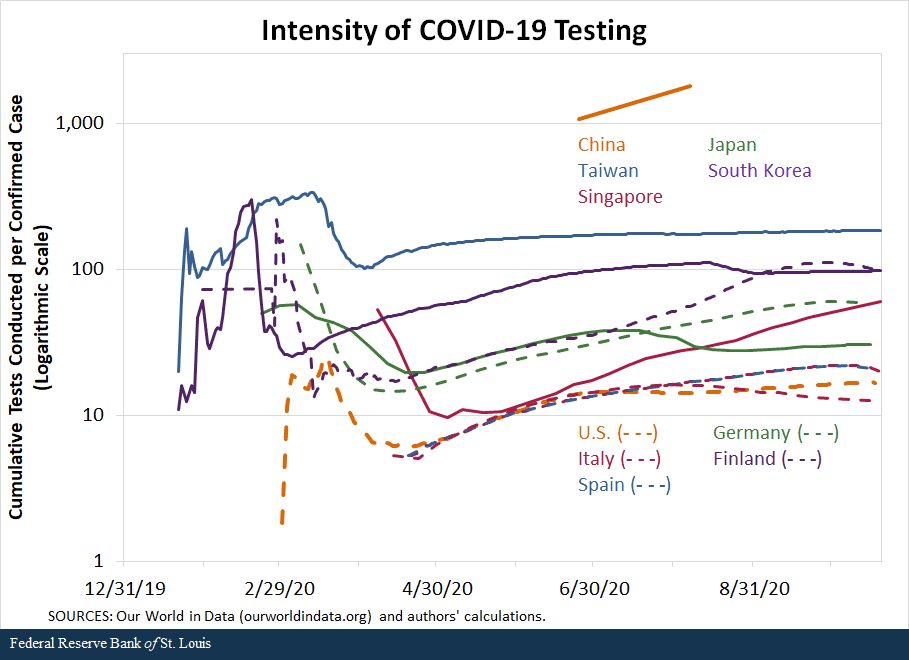
A number of interesting patterns emerge very clearly. First, China, Taiwan and Singapore, countries in Group 1, appear to have tested very aggressively at the early stages of the pandemic. The only numbers available for China seem to indicate that more than 1,000 tests have been implemented for each confirmed case of COVID-19. While displaying lower numbers, Taiwan appears to have reacted very quickly, performing up to 332 tests per confirmed case early in the pandemic, and then subsiding the testing effort as the virus came under control.
Singapore exhibits a very different behavior, in which very aggressive testing effort was performed at the end of the sample, precisely because the COVID-19 outbreak in the island was obviously getting out of control.
Representing Group 2, South Korea and Japan also exhibited a very aggressive effort in testing, reaching 300 tests per case for Korea and almost 60 for Japan. But more remarkable was how quickly the tests were implemented: The peaks of testing per confirmed case were in mid-February for Korea and early March for Japan.
The figure also presents the tests per confirmed case for five countries in Group 3—developed countries that had no significant exposure to SARS-1. On the one hand, Finland and Germany very quickly and aggressively started testing. The peak for Finland was 220 tests per case on Feb. 28, while the data available for Germany indicate that its peak was March 8, when the country performed almost 150 tests per case. After peaking, the countries’ testing efforts were on par with those of Japan for the next few months; by the end of the sample period, the intensity of testing by the two countries was similar to that of South Korea.
The U.S., Italy and Spain exhibited quite different behaviors. The peak of cumulative testing per confirmed case in the U.S. was March 18, when it reached 25 tests per case. After that, the country reduced its testing intensity, only to resume them by the end of April. Italy and Spain were also remarkably slow in their testing efforts. Along with the U.S., Italy and Spain were consistently below all the other countries in this figure in their testing efforts, even at the end of the sample, when a second wave had already begun in Europe and a third one was gaining traction in the U.S.
The Strictness of Policy Responses
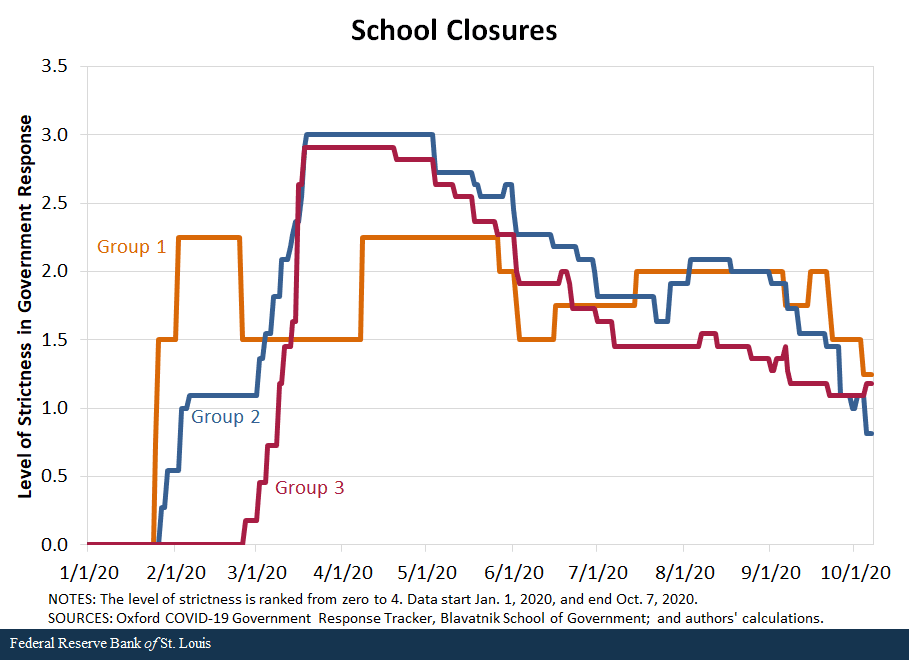
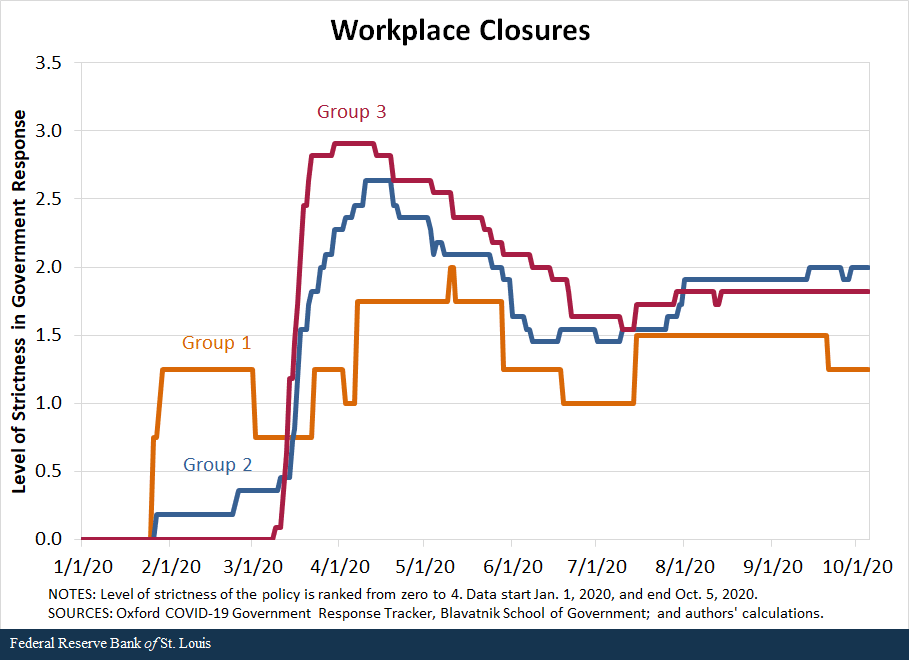
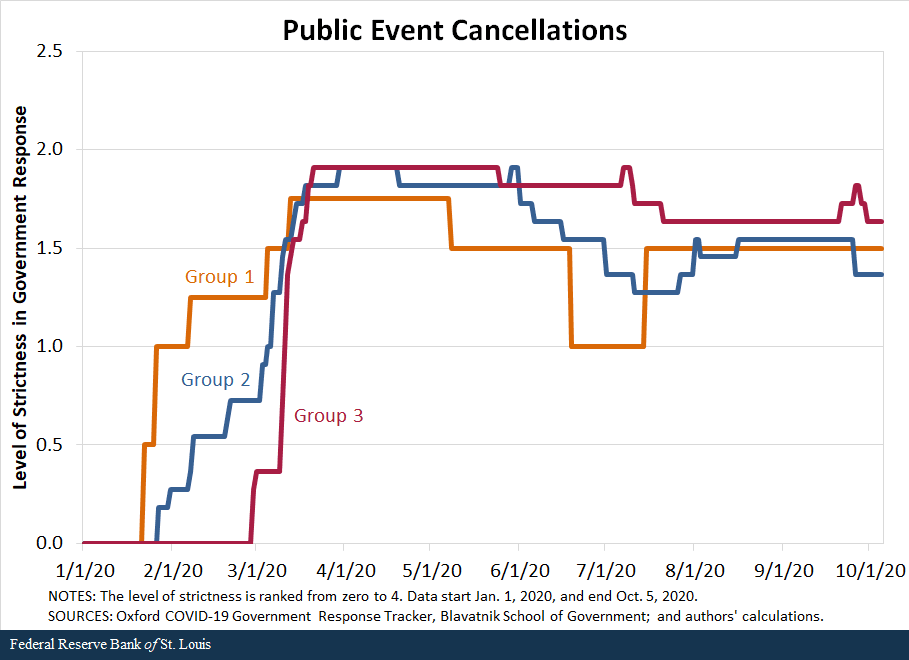
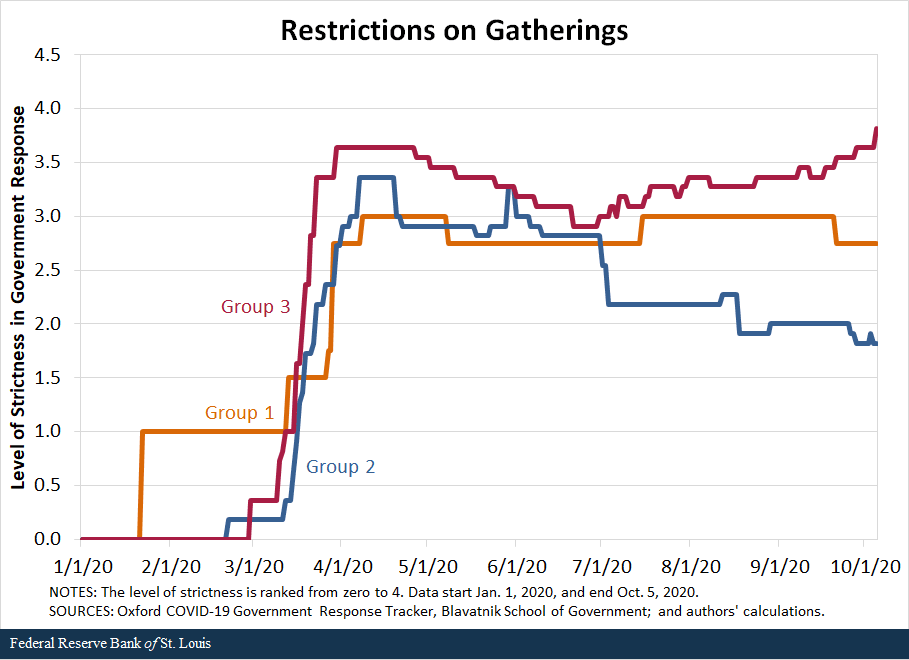
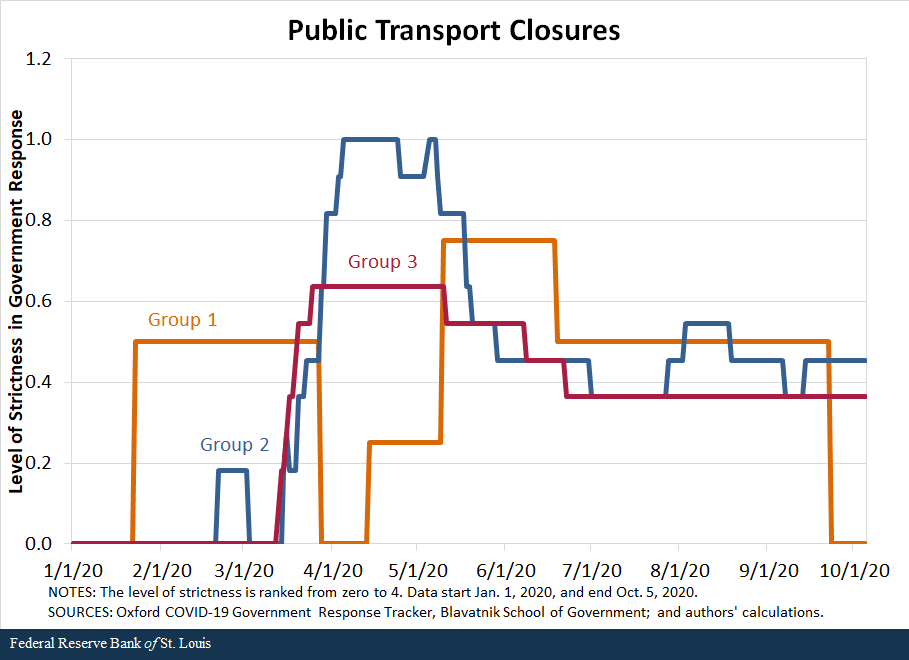
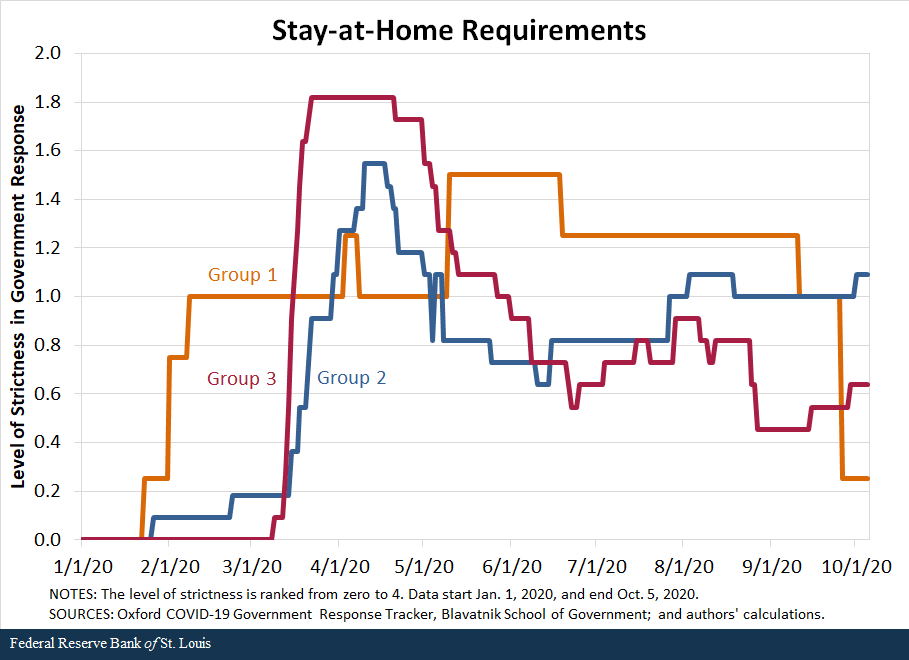
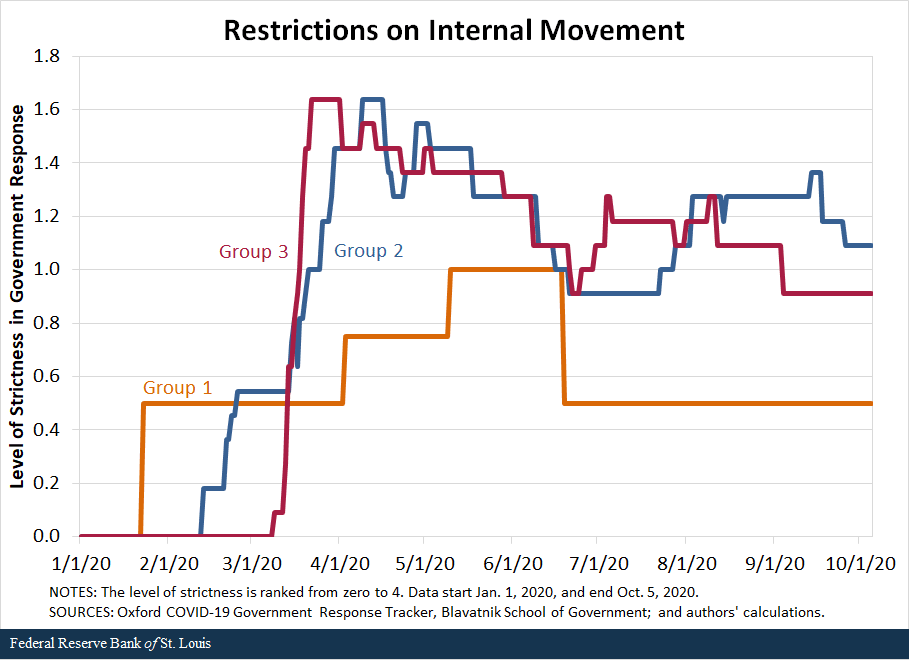
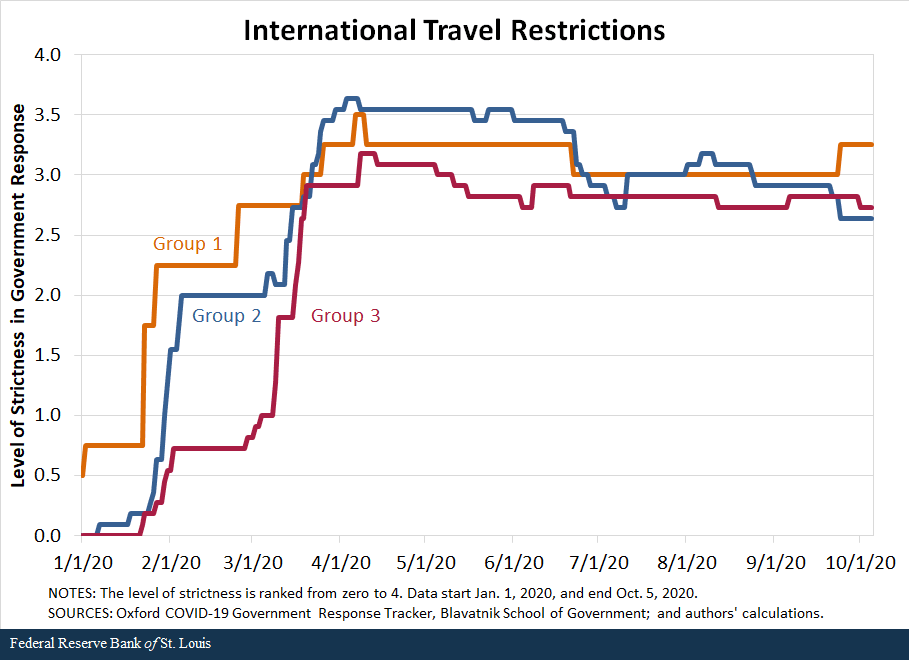
We also compare the response of countries along the second set of policies—containment and closures. We examine policies in eight areas: school closures, workplace closures, public event cancellations, gathering restrictions, public transport closures, stay-at-home requirements, internal movement restrictions, and international travel restrictions. For each policy, the indicators are recorded on an ordinal scale from zero to 4 that represents the level of strictness of the policy as defined by the Oxford COVID-19 Government Response Tracker, Blavatnik School of Government, our source for these data. We then compared the averages in policy responses of the three groups of countries.
The following figures show that in terms of all eight policies, countries in Group 1 were the first to respond to the pandemic, starting to implement policies in late January, and countries in Group 2 followed closely behind, imposing restrictions in early February. In contrast, most countries in Group 3 began to implement containment policies around early March but increased the strictness of the policies quickly.
By mid-March, countries in all three groups had similar levels of strictness in policies. Interestingly, countries in Group 3 have remained more restrictive in a few of the policies than countries in Groups 1 and 2. For some policies, such as school closings, workplace closings and public transport closings, countries in Group 1 started to loosen their restrictions in March, as the cases declined in those nations.Some restrictions were reimposed as the pandemic worsened globally during the summer and early fall; the clearest example of this is Singapore.
While not definitive, the data seem to suggest that the success of countries in Groups 1 and 2 can be, to a significant degree, attributed to swift and aggressive responses in testing, along with very strict but temporary restrictions on mobility. Moreover, the countries that followed these policies are precisely those that either had direct or indirect but close experience with the SARS-1 pandemic in the early 2000s; this suggests that they learned from that experience and became better prepared and more responsive to the COVID-19 pandemic.
Finally, we cast doubts on a hypothesis that explains the bulk of the observed differences in mortality rates on unobserved genetic differences between the Asian populations in Groups 1 and 2 and the populations in Group 3. Otherwise, how can such a hypothesis explain why Finland and Germany, which arguably reacted more similarly to Group 1 than to Group 3 countries, experienced much lower mortality rates than others, such as Italy, Spain and the U.S.? The gaps speak loud and clear: As of Oct. 20, 2020, the mortality rates were 117 deaths per million people for Germany and 63 per million for Finland, which are roughly a fifth to a tenth of the mortality rates experienced by the U.S., Italy or Spain.
Notes and References
- Our conclusions do not change if we use the averages weighted by the population of the countries.
- For example, leading Japanese scientists have argued that the Japanese may have a special immunity, possibly due to previous exposure.
- Some restrictions were reimposed as the pandemic worsened globally during the summer and early fall; the clearest example of this is Singapore.
Additional Resources
- St. Louis Fed’s COVID-19 resource page
- Regional Economist: Which Jobs Have Been Hit Hardest by COVID-19?
- On the Economy: COVID-19 and the Importance of Testing


Citation
Alexander Monge Naranjo and Qiuhan Sun, ldquoLearning from Experience: Why Nations May Have Responded Differently to COVID-19,rdquo St. Louis Fed On the Economy, Nov. 5, 2020.
This blog offers commentary, analysis and data from our economists and experts. Views expressed are not necessarily those of the St. Louis Fed or Federal Reserve System.
Email Us
All other blog-related questions