The State of COVID-19 around the Eighth District
As debates go on around the country relating to reopening the economy, this blog provides some facts and figures regarding how COVID-19 has impacted the largest metropolitan statistical areas (MSAs) around the Eighth Federal Reserve District.
Eighth District Info
In addition to the St. Louis Fed’s main office, it has branches in Little Rock, Ark., Louisville, Ky., and Memphis, Tenn. The table below provides some basic information on these four MSAs.
| Metropolitan Statistical Area | Number of Counties | Population (in Millions) | Date of First COVID Case | Date of First COVID Death |
|---|---|---|---|---|
| St. Louis | 15 | 2.80 | March 8 | March 20 |
| Little Rock | 6 | 0.74 | March 22 | March 30 |
| Louisville | 10 | 1.27 | March 9 | March 19 |
| Memphis | 8 | 1.35 | March 8 | March 26 |
The figure below illustrates the path of confirmed COVID-19 cases over roughly the last six weeks in the four MSAs.
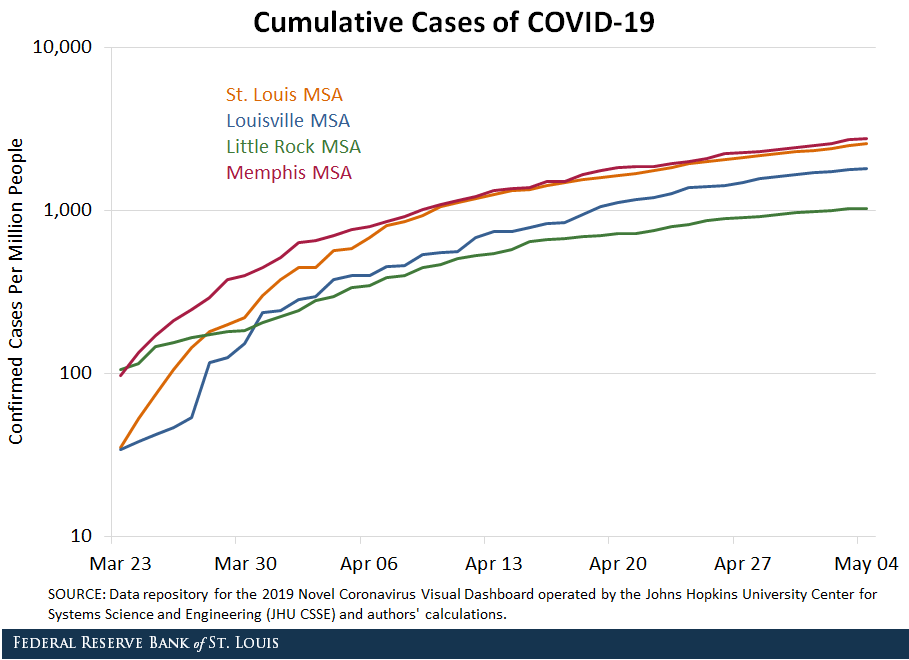
As states reopen and shift from a stay-at-home scenario to a scenario with fewer restrictions on businesses and households, this figure suggests a lower bound on cases and deaths to the extent that fewer restrictions could lead to a higher infection rate.
As of May 4, the St. Louis MSA had 2,550 cases per million people in its population, while Louisville and Memphis had 1,804 and 2,766 cases per million, respectively. Little Rock was substantially lower at 1,025 cases per million.Cases per million are calculated as the ratio of total number of cases to the population in millions. For example, St. Louis on May 4 would be 7,148 divided by 2.803.
Daily Cases of COVID-19
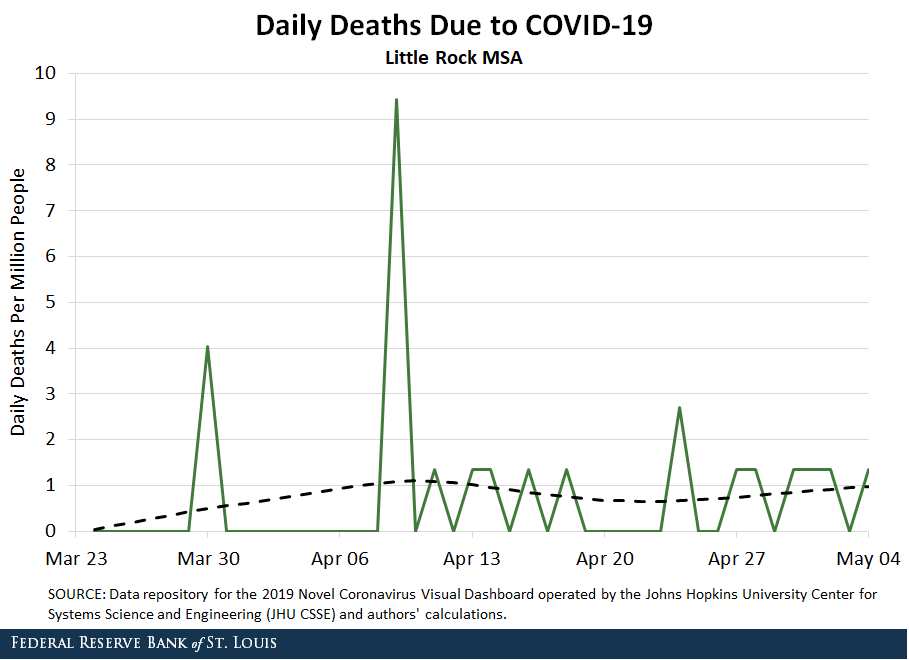
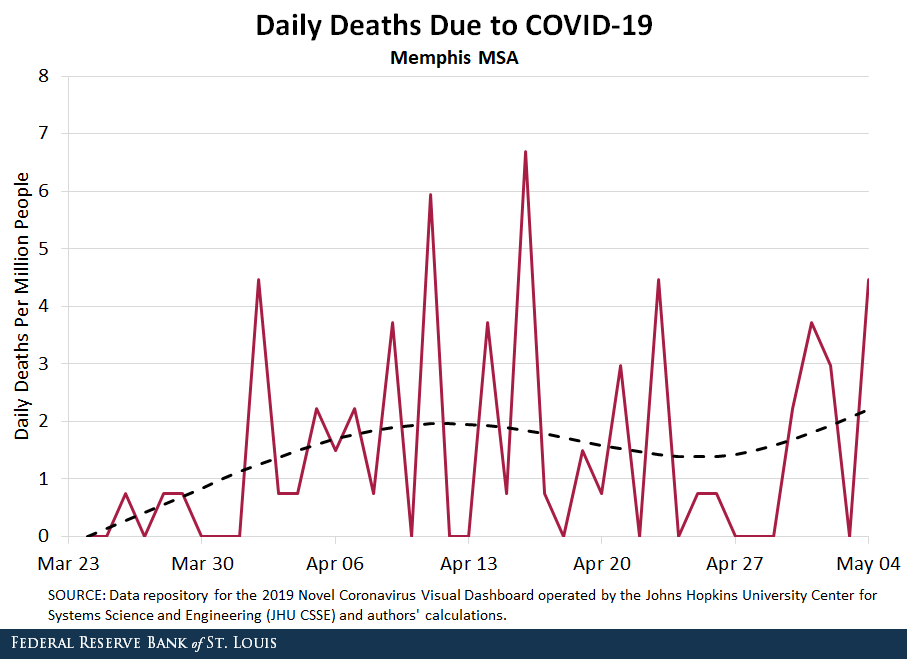
The daily confirmed cases have fluctuated considerably. In the figures below, the solid lines show the actual data, and the dotted lines show a smoothed version that best fits the data.
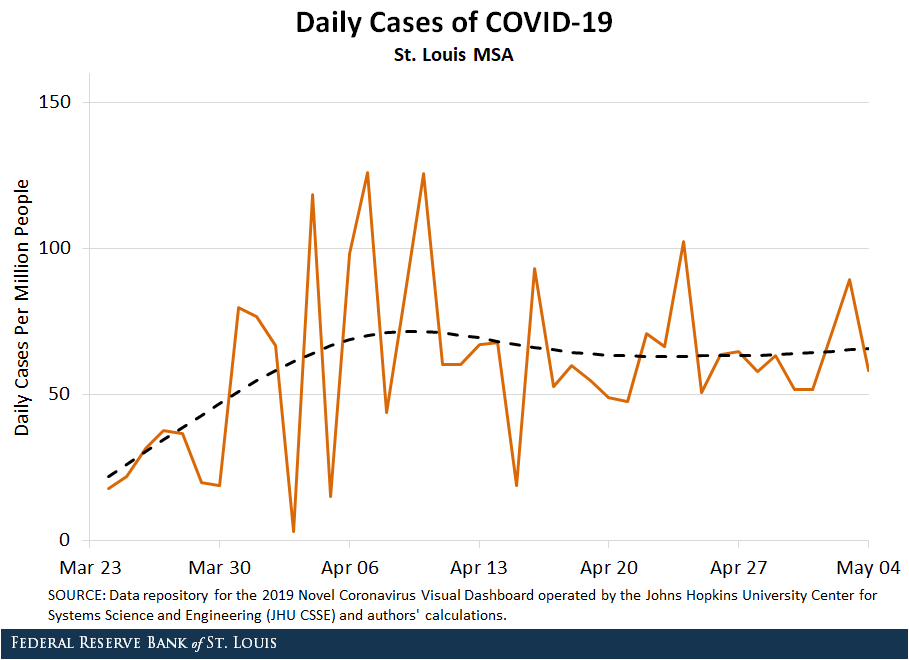
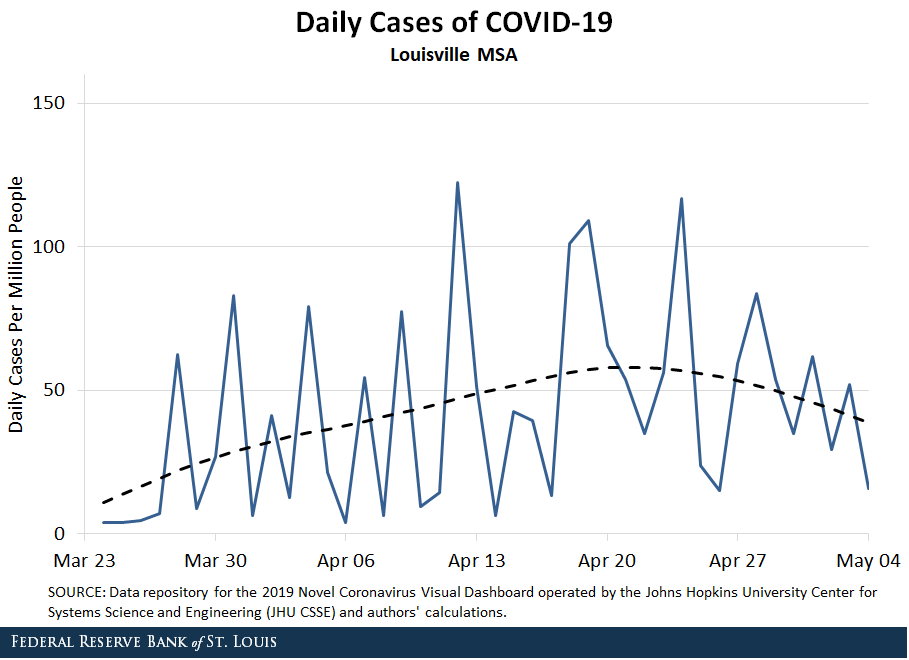
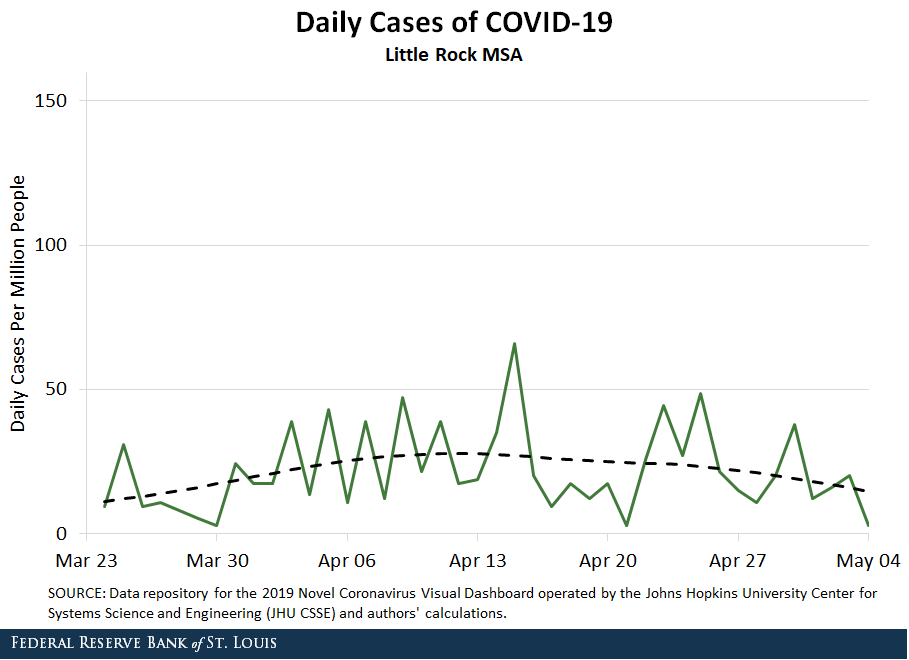
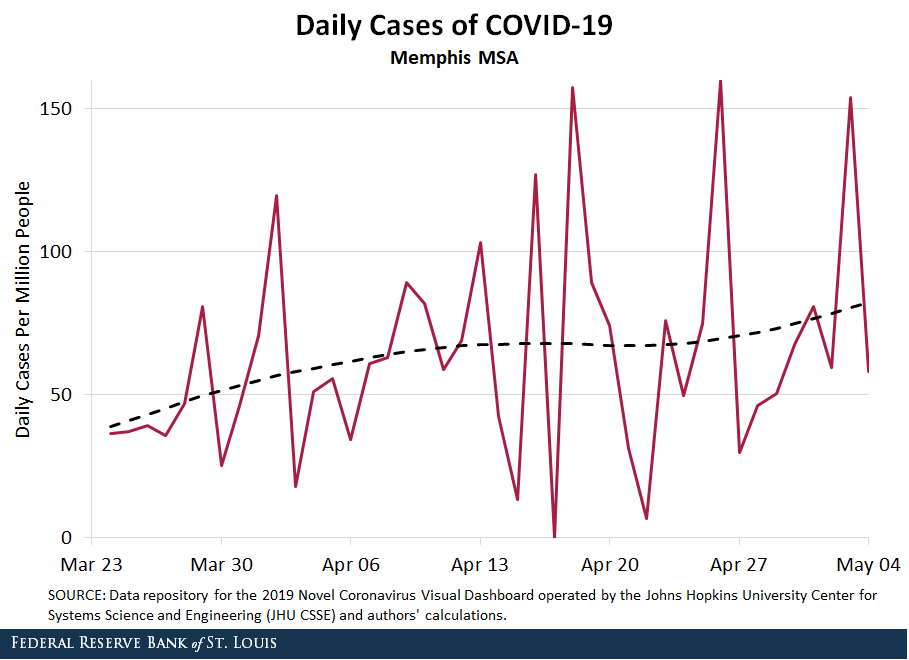
None of the MSAs meet a White House criterion for reopening a region: downward trajectory of documented cases within a 14-day period.See the White House’s webpage “Opening Up America Again.” The average daily growth rate of cases in St. Louis, Louisville, Little Rock and Memphis over the last 14 days have been 3.15%, 3.45%, 2.52% and 2.98%, respectively.
Cumulative and Daily COVID-19 Deaths
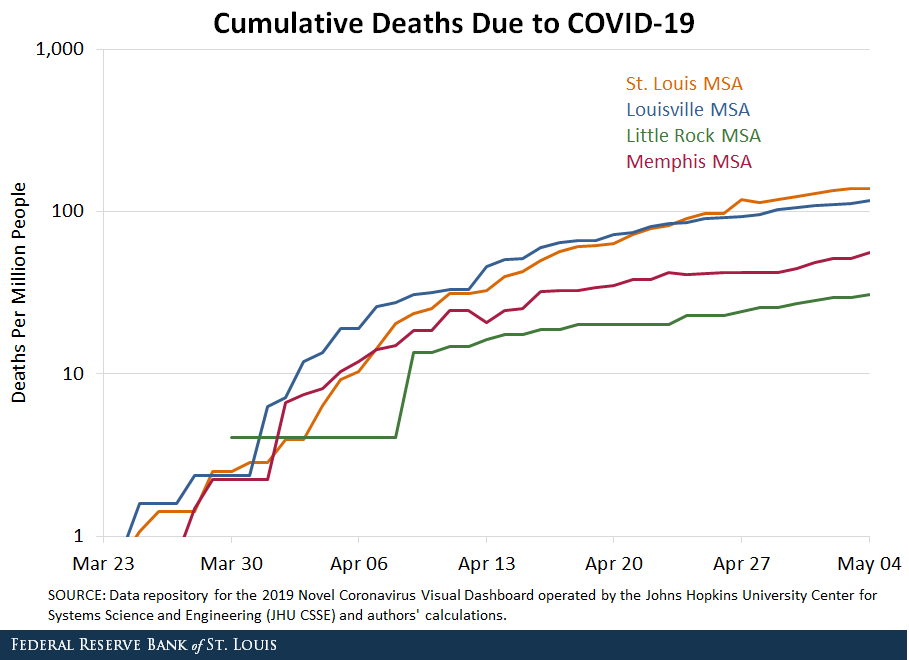
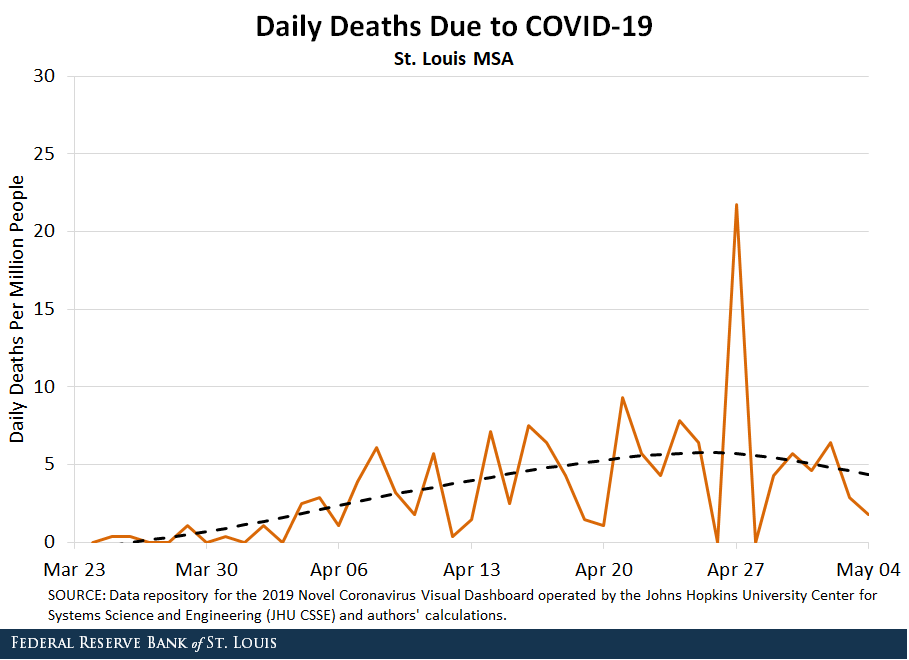
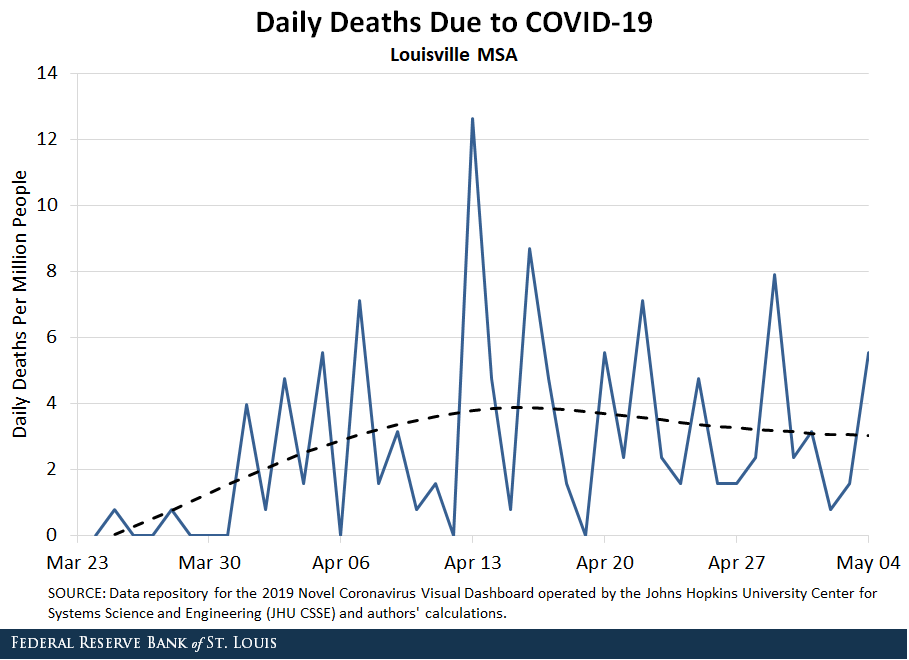
The next figures document the cumulative and daily deaths in the four MSAs. St. Louis and Louisville lead with more than 100 deaths per million people as of May 4. Memphis had a death rate of 55 per million, while Little Rock had the lowest death rate at 30 per million. Again, the daily death rate fluctuates too much to infer a sustained trend.
COVID-19 Deaths Per Case
Another metric of interest might be number of deaths per case. That is, the number of deaths relative to the number of confirmed cases of COVID-19.The ratio of deaths to cases in one MSA could be lower than that in another because one MSA may have more confirmed cases due to more extensive testing. The chart below illustrates that for the four MSAs.
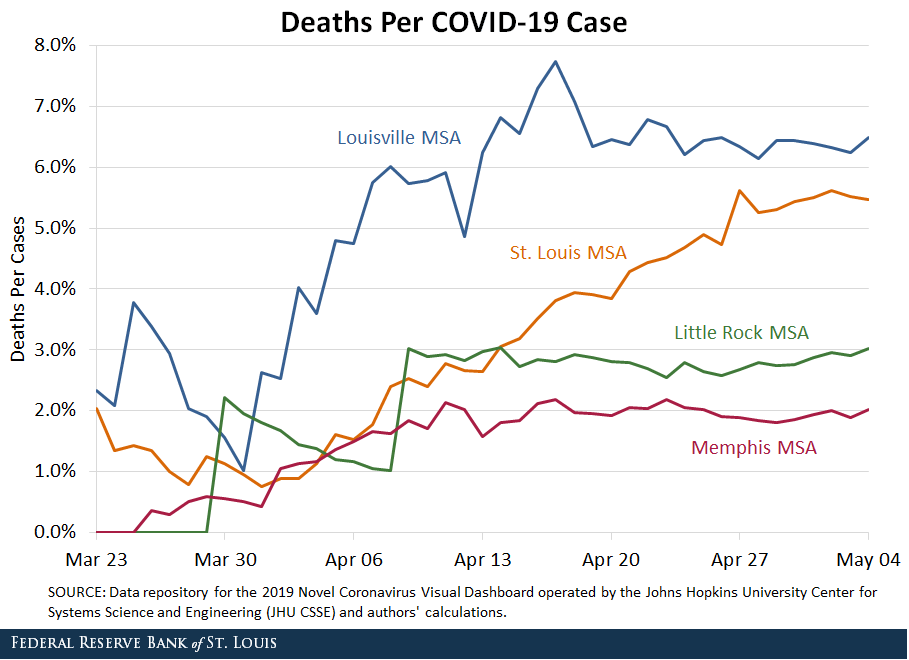
St. Louis seems to be the exception: It is the only MSA among the four that displays a steady rise in deaths per case over the last several weeks.
Notes and References
1 Cases per million are calculated as the ratio of total number of cases to the population in millions. For example, St. Louis on May 4 would be 7,148 divided by 2.803.
2 See the White House’s webpage “Opening Up America Again.”
3 The ratio of deaths to cases in one MSA could be lower than that in another because one MSA may have more confirmed cases due to more extensive testing.
Additional Resources
- On the Economy: Reopening the U.S.: Gauging the Trend of COVID-19 Transmissions
- On the Economy: COVID-19, School Closings and Labor Market Impacts
Citation
B. Ravikumar and Guillaume Vandenbroucke, ldquoThe State of COVID-19 around the Eighth District,rdquo St. Louis Fed On the Economy, May 6, 2020.
This blog offers commentary, analysis and data from our economists and experts. Views expressed are not necessarily those of the St. Louis Fed or Federal Reserve System.
Email Us
All other blog-related questions


