How Fast Are COVID-19 Death Rates Declining? U.S. vs. Other Countries
Many countries are past their peaks of daily confirmed cases of COVID-19 infections and deaths, and they’re reopening their economies gradually. This post documents how different countries look on the other side of the peak. That is, we answer the question: What are the daily COVID-19 death rates for various countries relative to their peaks?
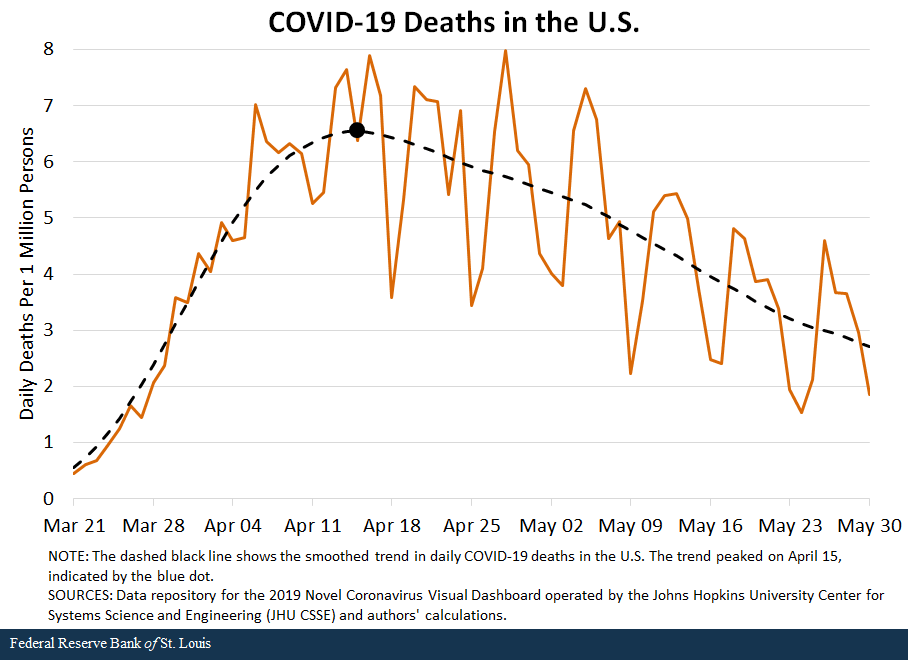
The figure below illustrates daily deaths per 1 million inhabitants in the U.S. since late March.

Since the daily data is noisy, we smoothed the data to show the trend in daily COVID-19 deaths in the U.S., represented by the dashed line in the figure. According to the smoothed line, the peak in the U.S. occurred on April 15 (indicated by the dot), and the daily rate was 6.55 deaths per 1 million persons.The actual count on that day was 6.37 deaths per 1 million persons.
COVID-19 Death Rates in Other Countries
We focused on four other countries for comparison:
- France
- Germany
- Italy
- U.K.
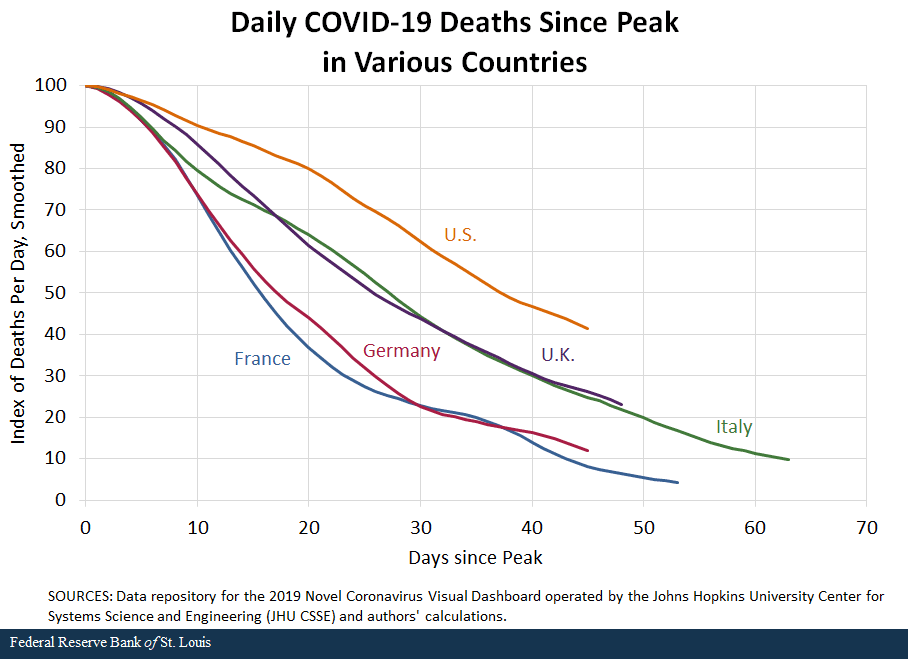
In the figure below, we normalized the peak in each country to be 100 to make the comparison easier.

The daily death rates in other countries have declined more rapidly than in the U.S. To illustrate this quantitatively, we computed “half-life” for each country. That is, after how many days did the smoothed daily death rate reach 50% of the peak death rate? The table below has the numbers.The peak for each country is based on the smoothed line for that country, similar to the calculation for the U.S. in the post’s first figure. The peak occurs at different dates for different countries.
| Peak Daily Death Rate Per 1 Million Persons | Half-Life (Days) | |
|---|---|---|
| France | 13.60 | 16 |
| Germany | 2.73 | 17 |
| Italy | 12.96 | 27 |
| U.K. | 14.04 | 26 |
| U.S. | 6.55 | 37 |
The pace of decline in the U.S. may be slow because its peak was not high relative to the other countries, so other countries had more room for decline in deaths. For instance, the daily death rate in France at its peak was 13.6 per 1 million persons, twice as high as the peak rate in the U.S. The daily rate declined by 50% in 16 days in France. In the U.S., the 50% decline took more than twice as long (37 days).
However, high peak versus low peak cannot be the entire story. Germany, for instance, had a much lower peak than the U.S., but its half-life is only 17 days.
The high death rate in the U.S.—relative to its peak—is likely an indication of a higher prevalence of the disease compared with the prevalence in other countries. Hence, reopening the economy and getting back to business as usual at this stage might be a riskier proposition for the U.S. than for other countries.
Notes and References
1 The actual count on that day was 6.37 deaths per 1 million persons.
2 The peak for each country is based on the smoothed line for that country, similar to the calculation for the U.S. in the post’s first figure. The peak occurs at different dates for different countries.
Additional Resources
- On the Economy: The State of COVID-19 around the Eighth District
- On the Economy: Social Distancing, but Mostly during the Workweek?
Citation
B. Ravikumar and Guillaume Vandenbroucke, ldquoHow Fast Are COVID-19 Death Rates Declining? U.S. vs. Other Countries,rdquo St. Louis Fed On the Economy, June 2, 2020.
This blog offers commentary, analysis and data from our economists and experts. Views expressed are not necessarily those of the St. Louis Fed or Federal Reserve System.
Email Us
All other blog-related questions


