


Staff Pick: How Many People Will Be Retiring in the Years to Come?
This blog will periodically rerun posts that were of particular interest. The following is a May 2019 post by Guillaume Vandenbroucke on how many people may be retiring in the U.S. in the near future.
The peak of the baby boom was in 1960. People born then will reach the typical retirement age of 65 in 2025. How many people are we talking about?
Answering this question is not only important for the Social Security Administration (SSA)—considering the potentially large group of retirees approaching their SSA benefit collection—but is also useful for policymakers interested in evaluating the performance of the labor market.
Labor Market Example
Suppose that in a given month:
- 100,000 workers retire.
- The Bureau of Labor Statistics (BLS) reports an increase in employment of 200,000 workers.
This implies that 300,000 people found a job. First, 100,000 people are needed to replace the jobs vacated by the retirees. Some of these jobs are not new, but the workers holding them are. (If all of the retiring workers are replaced, then none of these 100,000 jobs are new.) This replacement alone would imply that employment remained constant.
For employment to increase by 200,000 as announced by the BLS, it must also be that 200,000 people found new jobs. Thus, the number 300,000 is the total of all people finding a job in this particular month. In other words, BLS announcements tend to understate the performance of the labor market when the number of retirees is high.
Estimating the Number of Future Retirees
In this post, I will describe a preliminary estimate of the number of people retiring each month over the next 20 years. I started with the population of workers between the ages of 40 and 65 in 2018 using data gathered by IPUMS-USA. I then used age- and gender-specific mortality rates from the Human Mortality Database to compute how many people are expected to still be alive the next year (at only one year older).
I continued iterating this procedure for a few years, assuming that the age-specific mortality rates remain constant over the years I specify. Finally, I counted the number of people reaching age 65 each year, further breaking it down to the averages of those reaching 65 each day and each month. The figure below shows the result of this calculation.
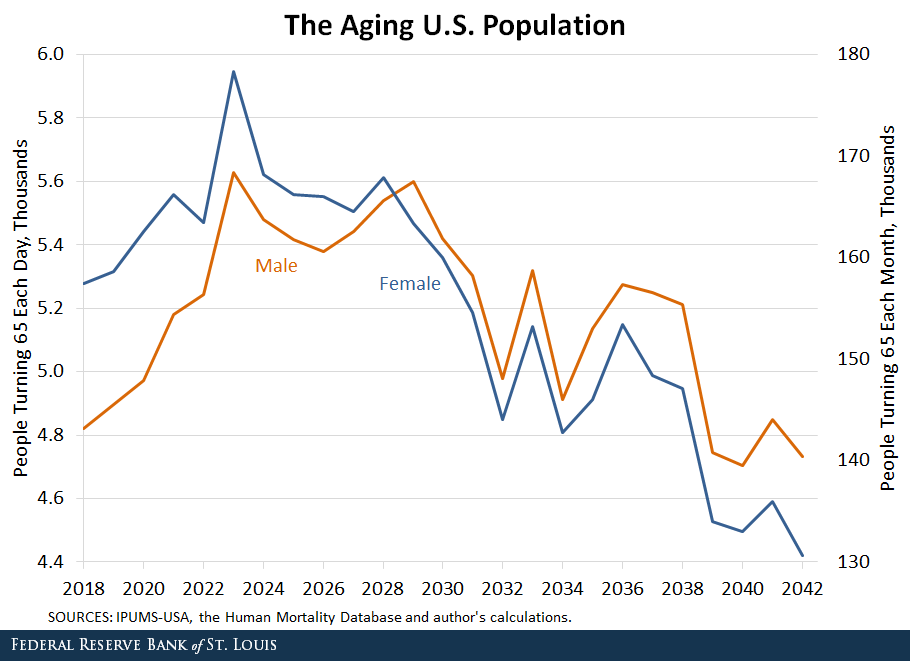
Initially, it is evident that there will be around 10,000 people (taking the total of retiring males and females) turning 65 each day for the next two decades. The right axis indicates the number of people turning 65 each month, which is an easier number to compare with the BLS monthly report on the current employment situation in the U.S. Not surprisingly, the peak corresponds to the retiring of the baby boomers. From 2025 onward, the trend is declining, which is likely because of the baby bust that followed the baby boom.
Additional Resources
- On the Economy: Aging Populations May Mean Lower Economic Growth
- On the Economy: What We Can Learn from Japan’s Aging Workforce
- On the Economy: The Effect of Aging on Wealth Inequality
Citation
ldquoStaff Pick: How Many People Will Be Retiring in the Years to Come?,rdquo St. Louis Fed On the Economy, Jan. 13, 2020.
This blog offers commentary, analysis and data from our economists and experts. Views expressed are not necessarily those of the St. Louis Fed or Federal Reserve System.
Email Us
All other blog-related questions