


Which War Saw the Highest Defense Spending? Depends How It’s Measured
Government spending on defense spiked during World War II, as might be assumed. But to put it in perspective, the amount spent per active duty person peaked at about half of what was spent per person in the 1990s.
The figure below shows three time series as percentages of gross domestic product (GDP):
- U.S. federal government spending on national defense
- Federal government spending on nondefense items
- State and local government spending
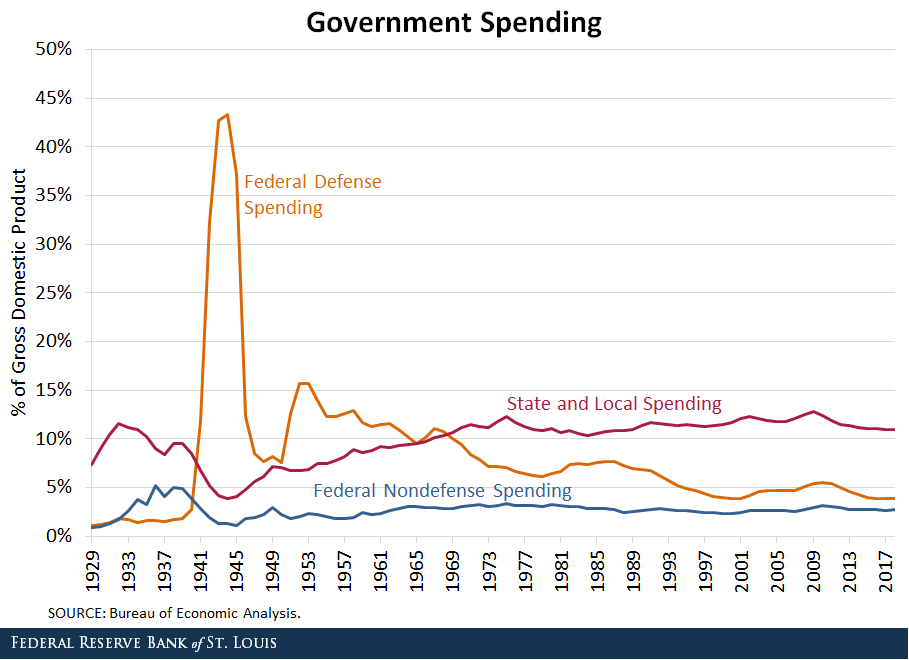
WWII stands out as an abnormal period: In 1943 and 1944, more than 40% of GDP was devoted to national defense. Total spending on national defense from 1940 and 1945 was a little over $5 trillion.In 2019 dollars. This represents about a quarter of 2018 GDP. (The numbers for 2019 GDP are not final yet.)
To illustrate the magnitude of U.S. spending during WWII, imagine spending $1 million per hour, 24 hours per day, for 365 days. At this pace, it would take 576 years to spend as much as the U.S. did during WWII.Thank you to B. Ravikumar for suggesting this calculation.
Examining Government Spending
Two remarks can be made about the figure. First, the increases in defense spending during the Korean War (1950-53), the Vietnam War (1965-75), the first Gulf War (1991) and the post-9/11 wars are small in comparison with WWII spending.
Second, the figure shows that no other government programs replicate the magnitude of WWII spending. There is an obvious bump in nondefense spending and state and local spending during the 1930s (the New Deal), as well as some increases in state and local spending in the early 1970s and around the 2007-08 crisis, but these are relatively small.
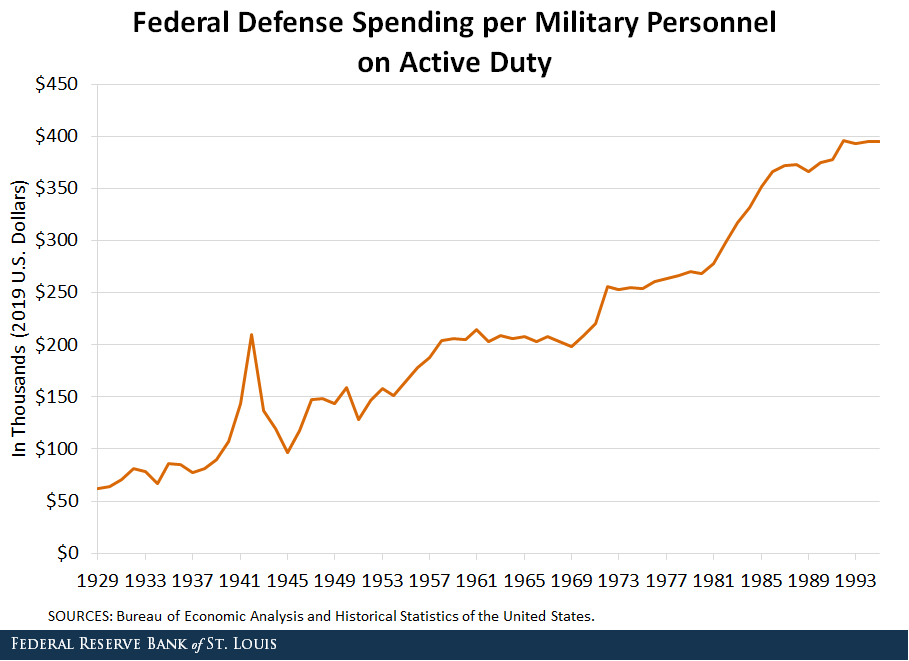
Defense Spending per Active Duty Personnel
During wars, the size of military personnel on active duty increases as well. In fact, part of the spending described in the figure above includes payments to active duty military personnel and to veterans, in addition to all other expenses related to national defense.
How does WWII compare with other wars when the increase in defense spending is normalized by the increase in military personnel? It should be noted that the increase in U.S. military personnel during WWII was massive: from less than 500,000 in 1940 to 12 million in 1945. The figure below plots defense spending per military personnel on active duty from 1929 to 1995.
A few points are worth mentioning:
- WWII stands out, once more, as a period of abnormally high spending per military personnel.
- Such high spending during WWII, however, occurred against the backdrop of a secular increase in defense spending per personnel.
Note that WWII active duty personnel “used” as many dollars as early Vietnam-era active duty personnel. Both used half of what 1990s personnel was using.
Potential Causes of Increased Defense Spending per Personnel
What caused the trend in defense spending per personnel? Part of it may be technological progress in military equipment, and part may be the general increase in income in the U.S. (Remember that a fraction of defense spending is the payment of military personnel.)
The strategic position of the U.S. may also play a role, since the period covered in the second figure coincides with the Cold War.
Finally, a specific event may have played a role. Consider, for instance, how flat the series in the second figure is during the first part of the Vietnam War. There is, then, a jump in 1968-69, which was marked by the subsequent U.S. response to the Tet Offensive.
Notes and References
1 In 2019 dollars.
2 Thank you to B. Ravikumar for suggesting this calculation.
Additional Resources
- On the Economy: How World War I Changed Marriage Patterns in Europe
- On the Economy: The History of Prices and Inflation in the U.S.

Citation
Guillaume Vandenbroucke, ldquoWhich War Saw the Highest Defense Spending? Depends How It’s Measured,rdquo St. Louis Fed On the Economy, Feb. 4, 2020.
This blog offers commentary, analysis and data from our economists and experts. Views expressed are not necessarily those of the St. Louis Fed or Federal Reserve System.
Email Us
All other blog-related questions