Labor Market Polarization across the U.S.
 Getty/HHakim
Labor market polarization refers to the decrease in job opportunities in middle-skill occupations that typically involve routine tasks, such as occupations in manufacturing, production and transportation. This is simultaneously associated with an increase in employment in occupations that involve nonroutine tasks, such as jobs in managerial and professional occupations and in personal care and service occupations.
Polarization in the labor market is linked to two main factors:
- Increased automation of routine tasks
- Increased globalization and offshoring
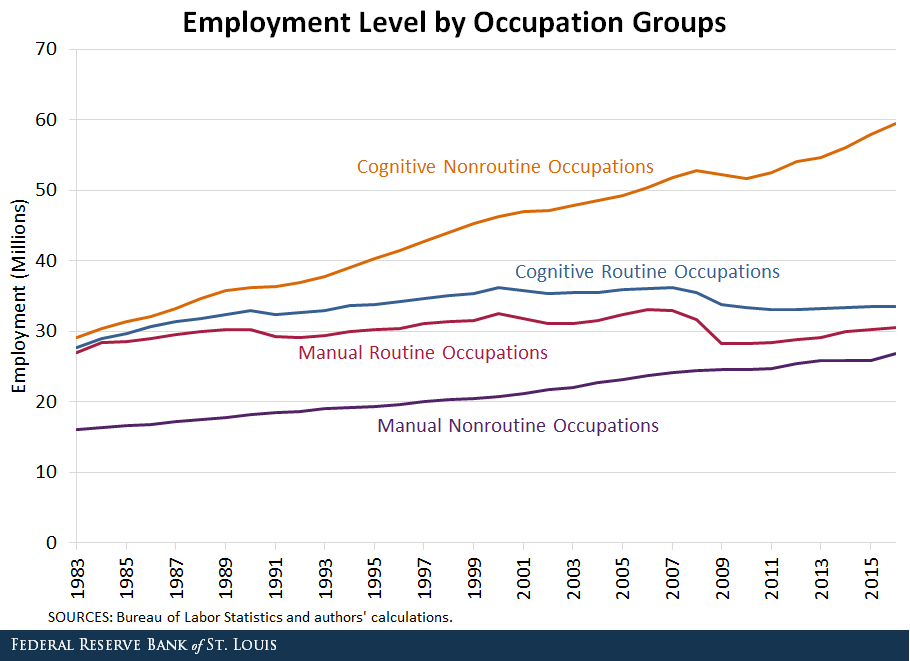
At the national level, we observe in the figure below that employment in nonroutine occupations—both cognitive and manual—has been steadily increasing since the 1990s. On the other hand, employment in routine occupations has been stagnant or declining.

Within the U.S., the composition of industries varies. We want to analyze the impact of job polarization at a regional level to understand how states and regions have been affected.
For this, we focused on state level trends in routine manual occupations. In 1990, the states with the highest employment shares in routine manual occupations were:
- South Carolina (35.7 percent)
- North Carolina (35.3 percent)
- Mississippi (35.0 percent)
- West Virginia (34.5 percent)
- Arkansas (34.4 percent)
Change in Manual Routine Occupation Shares
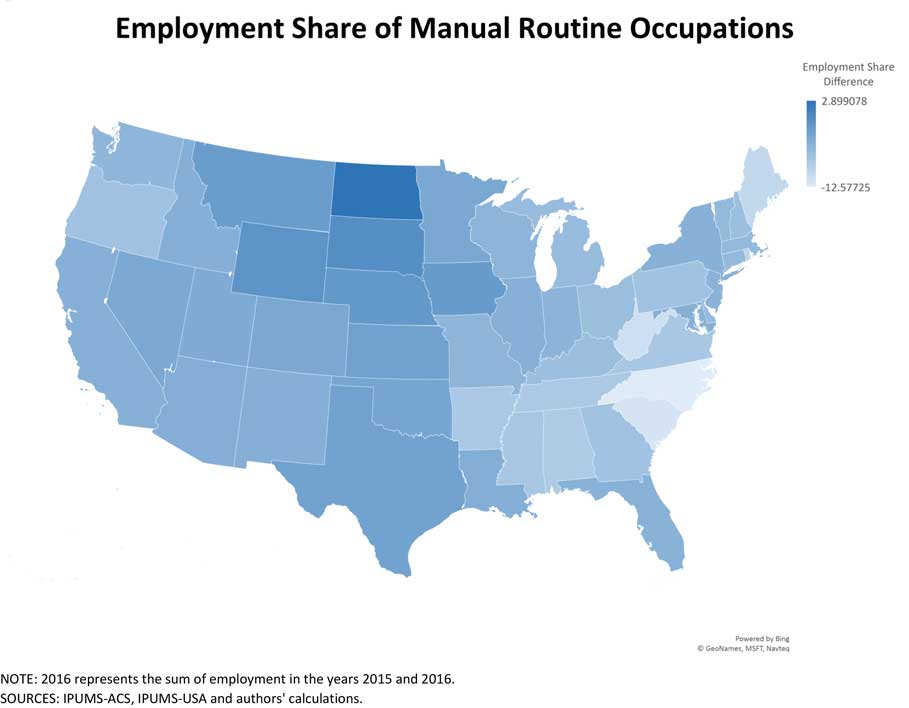
Jobs losses from 1990 to 2016 is among the highest for some of these states. The figure below shows the difference in employment shares between 1990 and 2016 for manual routine occupations across the U.S.2016 represents the sum of employment in the years 2015 and 2016.

We observed that the only state to experience an increase in employment share was North Dakota (2.9 percent). Most likely, the boom in the oil industry led to many new jobs in manual routine occupations in this state.
All other states experienced a decline in employment shares. Some of the states that experienced the largest declines were states with the largest shares in 1990, such as:
- North Carolina (-12.6 percent)
- South Carolina (-11.7 percent)
- West Virginia (-11.0 percent)
States like South Dakota, Wyoming, Nebraska and Iowa experienced a more moderate decrease.
GDP Growth during This Time
It would be interesting to look at the growth of GDP for the different states in this time period. We observed that states that experienced a greater decline in employment shares also experienced lower growth in real GDP per capita between 1990 and 2016.
The relationship between GDP per capita and labor market polarization is beyond the scope of this blog post and a fruitful avenue of future economic research. However, it is worth noting that job polarization has led to a decline in the earnings for middle-skill jobs, which is linked to an increase in earnings inequality.
Notes and References
1 2016 represents the sum of employment in the years 2015 and 2016.
Additional Resources
- On the Economy: Jobs Involving Routine Tasks Aren’t Growing
- On the Economy: Changing Job Market Leads to Polarization
- On the Economy: The Growing Skill Divide in the U.S. Labor Market
Citation
ldquoLabor Market Polarization across the U.S.,rdquo St. Louis Fed On the Economy, Feb. 4, 2019.
This blog offers commentary, analysis and data from our economists and experts. Views expressed are not necessarily those of the St. Louis Fed or Federal Reserve System.
Email Us
All other blog-related questions

