


Do Yield Curve Inversions Predict Recessions in Other Countries?
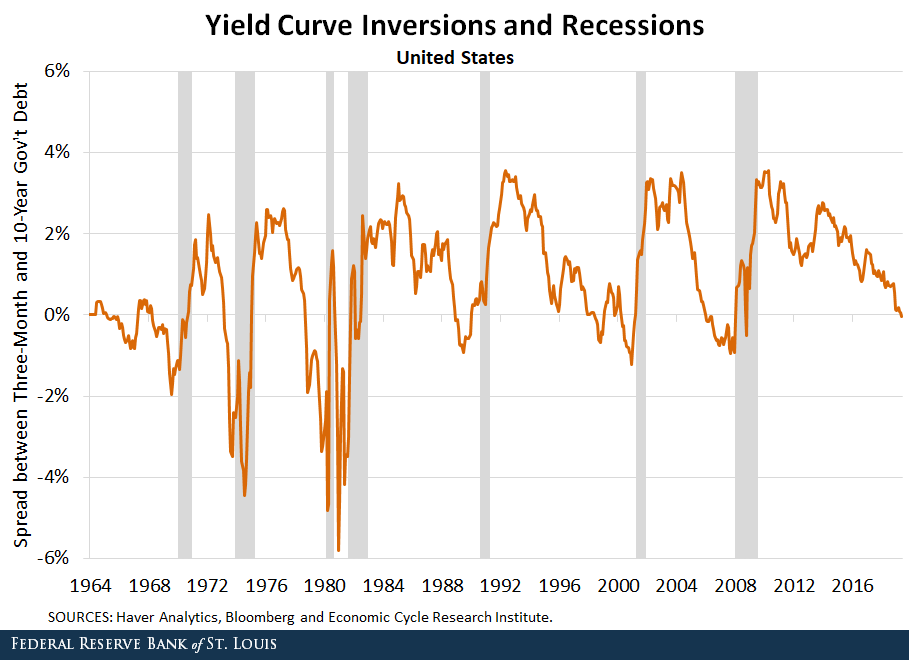
The U.S. yield curve—a plot of U.S. government bond yields over various maturities—inverted in both March and May. Yield curve inversions occur when the rate of return on a short-term government bond is higher than that of a long-term bond. For example, a one-month Treasury bill might yield more than a 10-year Treasury note.
Over the past 50 years, every U.S. recession was preceded by a yield curve inversion (although the length of time between inversion and recession has varied). Understandably, many investors regard the yield curve as a strong predictor of recession in the U.S., but does the relationship also hold for other countries?
In this blog post, we examine the yield curve for six countries with some of the largest advanced economies in the world:
- Canada
- France
- Germany
- Italy
- The U.K.
- The U.S.
Examining Yield Curves
A simple way to evaluate whether yield curve inversion predicts recession is to look at a time series graph of the yield curve and recession dates for each country. If the yield curve is a good indicator of recession, then inversions will closely precede recessions.
We’ll ask two questions for each country:
- If there is a recession, did the yield curve invert beforehand?
- If the yield curve inverts, does a recession follow it in a fairly short amount of time (e.g., one or two years)?
Recession Periods
One hurdle to examining yield curve inversion internationally is identifying a common definition of recession and expansion. In the U.S., recession is defined by the National Bureau of Economic Research’s Business Cycle Dating Committee.
Because this same committee does not exist in every country, the Economic Cycle Research Institute (ECRI) produces business cycle dates for many world countries using the same methodology as the NBER.
Yield Curve and Recessions across Countries
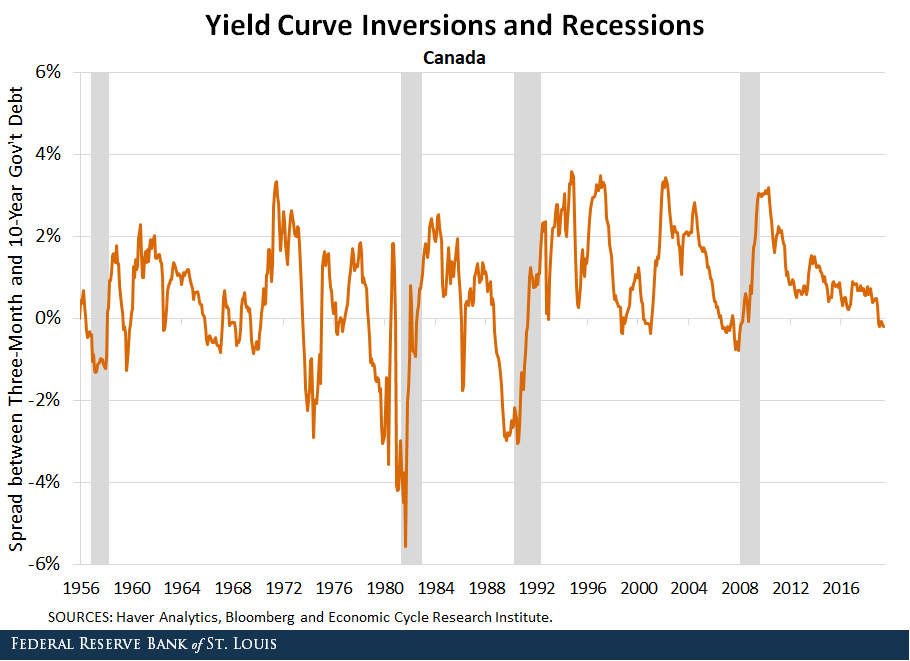
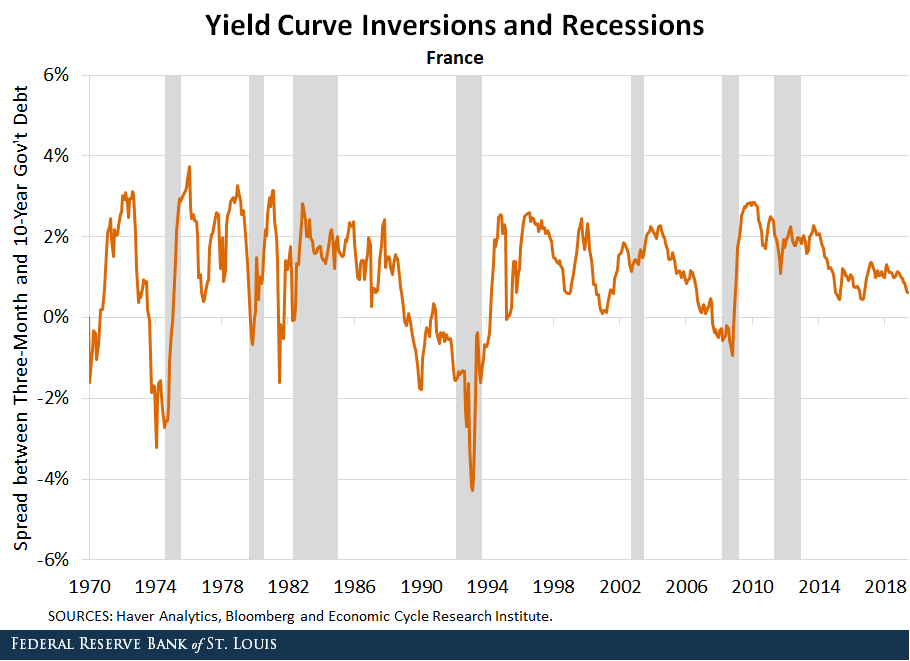
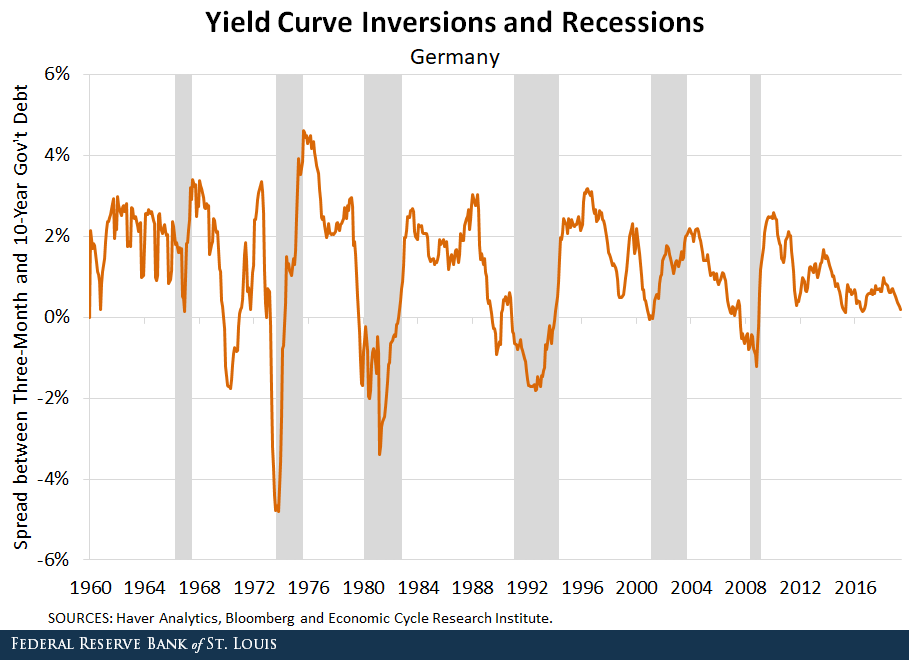
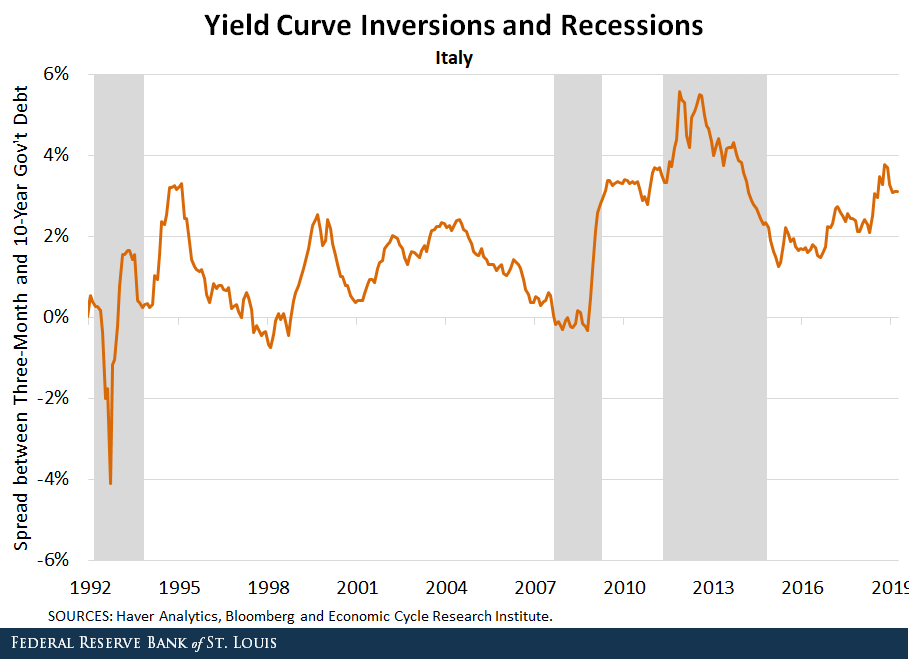
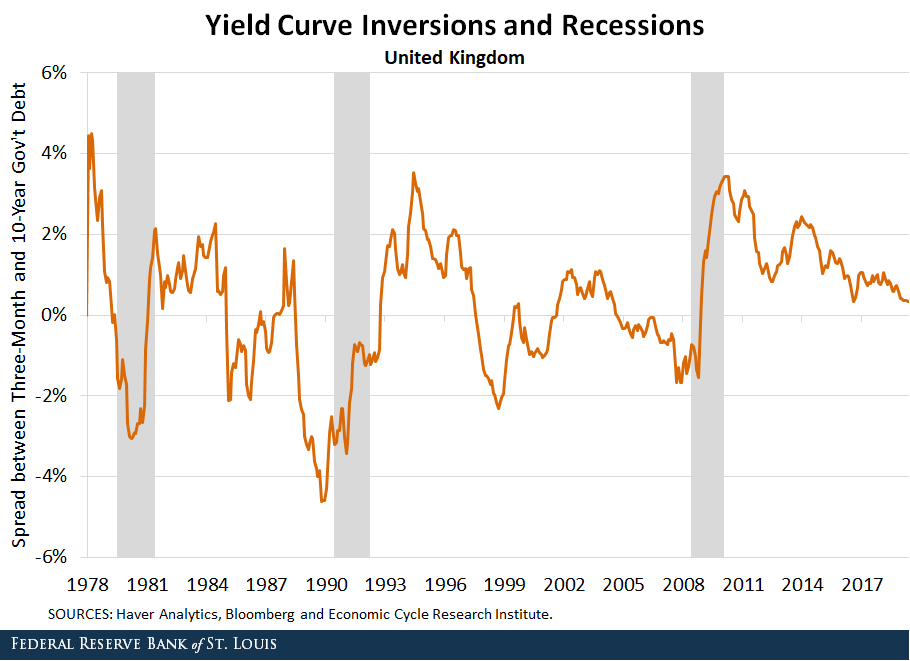
The figures below show the ECRI recession dates and the spread between three-month and 10-year government debt for the six countries we mentioned previously, as far back as the data goes for each country.
In all countries except Italy, recessions were generally predated by a yield curve inversion. A few yield curve inversions (the early 1980s in the U.K., the late 1970s in France and the early 2000s in Germany) were almost synonymous with the start of recessions, but in each case inversion occurred slightly before or at the same time as the downturn.
In the U.K. and Canada, several yield curve inversions occurred that did not predate recessions. These false positives mean the yield curve is a less reliable indicator of recession in these countries.
In Germany, France and the U.S., almost every yield curve inversion was followed by a recession within a few years, suggesting that false positives may be unlikely in these countries.
The relationship was weakest in Italy. Its yield curve inverted during the first recession in the sample and slightly during the second recession. In the third recession, however, the yield curve was positive and increasing before the recession.
Conclusion
It is clear, then, that yield curve inversion is a more useful signal of oncoming recession in some countries than in others, though it is usually at least somewhat useful. These results have obvious implications for how investors and others should view yield curve inversions in other countries and raise interesting questions about the complex relationship between yield curve inversion and the health of an economy.
Additional Resources
- On the Economy: Predicting Recessions: Which Signals Are More Accurate?
- On the Economy: Can an Inverted Yield Curve Cause a Recession?
- On the Economy: The Yield Curve vs. Unemployment Rate in Predicting Recessions

Citation
Sungki Hong, ldquoDo Yield Curve Inversions Predict Recessions in Other Countries?,rdquo St. Louis Fed On the Economy, Aug. 5, 2019.
This blog offers commentary, analysis and data from our economists and experts. Views expressed are not necessarily those of the St. Louis Fed or Federal Reserve System.
Email Us
All other blog-related questions